
Accounting practices are increasing software expenditure without commensurate gains in systems coherence: annual outlay rises year over year while fully integrated application portfolios remain a minority. A systematic secondary synthesis of global practice-technology benchmarks.

Findings at a glance
Each number jumps to the section it comes fromThe 4-Zone architecture
Section 3, below ↓The substrate
Identity, resilience, connectivity, institutional knowledge. The layer everything stands on and nobody budgets for.
Front office
Attract, qualify, schedule, capture.
Mid-office
Scope, engage, collect, recover. Where the $76k goes missing.
Back office
Ledger, workflow, capture, payroll, compliance.
Advisory & AI
Analyse, forecast, advise. Blocked, mostly, by Zone 0 and Zone 2 problems.
The core finding: technology’s value is moderated by integration coherence rather than expenditure magnitude. It is also the framework every review on this site is scored against — see the zone protocols.
Practice Technology Benchmark Series
Every paper, in order-
No. 1
Application Sprawl, Operational Friction, and the 4-Zone Functional Architecture
-
No. 2
[Coming soon…]
Singh, R. (2026). Application Sprawl, Operational Friction, and the 4-Zone Functional Architecture in Accounting Information Systems: A Systematic Secondary Synthesis of Global Practice-Technology Benchmarks. VerityLoft Research, Practice Technology Benchmark Series. https://verityloft.com/research-the-state-of-accounting-technology/
Link back and you do not need permission.
Inside the paper
Or just keep scrolling — it starts belowThe full paper begins below.
Ravi Singh
VerityLoft Research, Practice Technology Benchmark Series
Correspondence: VerityLoft Research
Manuscript type: Original research — systematic secondary synthesis
Article type: Systematic review (systematic secondary synthesis with quantitative meta-aggregation)
Reporting standard: PRISMA 2020 (Page et al., 2021), adapted for a benchmark-data evidence base (see Section 2.1 and Figure 1)
ORCID: https://orcid.org/0009-0005-5512-9842
Structured Abstract
Purpose. Accounting practices are increasing software expenditure without commensurate gains in systems coherence: annual outlay rises year-over-year while fully integrated application portfolios remain a minority. This investment–realisation gap reproduces the productivity paradox documented in the information systems literature, yet remains under-theorised in accounting information systems (AIS) scholarship, where research attention has concentrated on enterprise resource planning (ERP) adoption in large organisations rather than on the technology architecture of the small and mid-sized professional practice. This study asks whether operational outcomes in that population are more closely associated with integration coherence than with expenditure magnitude.
Design/methodology/approach. This systematic secondary synthesis with quantitative meta-aggregation follows PRISMA 2020 conventions adapted for a benchmark-data evidence base, and applies established grey-literature standards for management research (Adams et al., 2017) with formal AACODS source appraisal. Structured searches of producer research programmes, professional-body repositories, academic databases, and regulatory repositories were screened against pre-specified eligibility criteria (Figure 1). Three independently produced 2026 datasets met criteria: the Intuit Accountant Technology Survey (n = 725 United States accounting professionals, fielded May 2026); the Ignition State of Client Engagement Global Report, conducted with YouGov; and the Xero State of the Industry global benchmarks. Nineteen regulatory instruments from authorities across the United States, Canada, the United Kingdom, Australia, and New Zealand were included. The unit of analysis is the practice, stratified by headcount. Every finding carries an explicit evidence confidence rating.
Findings. Firms reported mean annual software expenditure of USD 21,000–22,000 against a prior-year baseline near USD 19,000, running a mean of ten applications; 41% reported full integration and 48% fragmented configurations, with the residual 11% uncharacterised in the source instrument. Fragmentation was associated with a mean loss of five hours per employee weekly to manual data transfer — the productivity tax — 90% reporting workforce fatigue or burnout, and mean unrecovered out-of-scope work of USD 76,636 per United States practice, with comparable magnitudes in Australia and the United Kingdom. Artificial intelligence adoption reached 88% for client deliverables, yet only 30% reported embedded deployment, and 30% named manual data cleanup as the principal barrier to advisory expansion — ahead of staffing and application overload.
Originality/value. Findings support a dependency-ordered model in which realised IT business value is moderated by integration coherence rather than expenditure magnitude, consistent with the information-processing view of organisation design and task–technology fit. The 4-Zone Functional Architecture is advanced as a taxonomy classifying practice technology by function rather than vendor, and as a remediation-sequencing diagnostic. Advisory and artificial intelligence capability cannot be procured independently of the substrate supplying their data.
Keywords
Accounting information systems; application sprawl; practice technology; enterprise resource planning; productivity paradox; information-processing view; task–technology fit; integration coherence; IT business value; small and medium-sized practices; operational efficiency; systems integration; value-based pricing; artificial intelligence adoption; client advisory services; grey literature synthesis
JEL Classification: M41, M15, L86, O33, D24, L84, K34
(M41 Accounting; M15 IT Management; L86 Information and Internet Services, Computer Software; O33 Technological Change — Choices and Consequences, Diffusion Processes; D24 Production, Capital Productivity; L84 Personal, Professional, and Business Services; K34 Tax Law.)
1. Introduction and Background
1.1 The Investment–Realisation Gap
The accounting profession has, over the course of a single benchmark cycle, moved technology expenditure from a peripheral administrative line item to a determinant of practice capacity, profitability, and client retention. This transition is well attested in the expenditure data. What is far less well attested is a corresponding improvement in operational outcomes. The 2026 benchmark evidence synthesised in this study describes a profession that spends materially more on software each year while the proportion of firms able to convert that spend into automated, low-friction workflow remains static and, on several measures, minoritarian.
The phenomenon is not adequately described as under-investment, nor as poor vendor selection. Firms in the observed population are purchasing capable, well-regarded software. The deficit arises instead at the seams — the interfaces between applications that were each acquired to resolve a discrete operational problem and that, collectively, produce an architecture no single purchasing decision anticipated. This study designates the resulting condition application sprawl: the accumulation of functionally rational but architecturally uncoordinated software instances within a single practice, and the operational friction that accumulation generates.
The distinction between expenditure and realisation is the central analytical concern of this paper. Where the practitioner literature has tended to treat technology adoption as a monotonic good, the evidence assembled here indicates a conditional relationship: expenditure yields operational return only where integration coherence is present, and in its absence expenditure may increase rather than reduce the coordination burden borne by staff.
1.2 Theoretical Context
Three established streams within the information systems literature provide the theoretical scaffolding for this analysis.
The first is the productivity paradox literature, which documented the historical difficulty of observing productivity returns commensurate with information technology investment (Brynjolfsson, 1993) and subsequently attributed much of the apparent shortfall to mismeasurement, lags, and — most relevantly here — the absence of complementary organisational restructuring (Brynjolfsson & Hitt, 1998). The profession-level pattern reported in this study is consistent with that later resolution: firms that have purchased technology without restructuring the processes and interfaces around it capture markedly less of its available return.
The second is the information-processing view of organisation design (Galbraith, 1974), which frames the firm as a system whose structure must match the information-processing load its tasks impose, and the associated literature on coordination cost (Malone & Crowston, 1994). Application sprawl is, in these terms, a structural mismatch: each additional non-integrated application increases the volume of inter-system coordination that must be performed by human actors, converting what was intended as automation into a manual coordination obligation. The five-hour weekly loss documented in Section 4.4 is a direct empirical measure of this coordination residue.
The third is the data quality and downstream-use literature (Wang & Strong, 1996), together with work on enterprise systems integration (Davenport, 1998; Markus & Tanis, 2000) and absorptive capacity (Cohen & Levinthal, 1990). These streams jointly predict that the analytical and advisory value a firm can extract from its data is bounded by the accessibility, timeliness, and intrinsic quality of that data — a prediction the present findings support with unusual directness, since practices in the sample nominated data cleanup, rather than talent or capital, as the binding constraint on their advisory ambitions.
Additionally, task-technology fit theory (Goodhue & Thompson, 1995) and the resource-based treatment of IT business value (Melville et al., 2004) inform the interpretation offered in Section 5: that integration coherence functions as a moderating variable between technology expenditure and firm performance, and constitutes the complementary organisational resource without which the technology asset is inert.
These theoretical anchors are drawn from the established literature and are not part of the synthesised benchmark corpus; they are used interpretively rather than evidentially.
1.3 The Research Problem
Existing AIS scholarship has extensively examined enterprise resource planning adoption in large organisations, audit technology, and continuous auditing. It has devoted considerably less attention to the technology architecture of the small and mid-sized professional accounting practice, notwithstanding that this population constitutes the overwhelming majority of firms by count and employs a substantial share of the profession. The available evidence base for this population is largely commercial: vendor-sponsored and industry-association benchmark studies, published without peer review, methodological appendices, or common definitional standards, and rarely synthesised across sources.
This creates two problems. First, individual benchmark figures circulate in professional discourse without the cross-source triangulation that would establish whether they describe a common underlying phenomenon. Second, the absence of a shared classificatory framework means that practice technology is discussed by vendor name rather than by function, which obstructs comparison across firm sizes and across jurisdictions where the dominant vendors differ.
1.4 Research Objectives
This study pursues four objectives:
- To aggregate and triangulate the principal 2026 global benchmark datasets on accounting practice technology into a single, internally consistent evidentiary account, with explicit notation of sample provenance and jurisdictional applicability.
- To formalise a functional taxonomy — the 4-Zone Functional Architecture — that classifies practice technology by operational function rather than by vendor, enabling cross-jurisdictional and cross-tier comparison.
- To test the descriptive proposition that operational outcomes in the observed population are more closely associated with integration coherence than with expenditure magnitude.
- To derive managerial implications regarding remediation sequence, pricing-model transition, and the preconditions for advisory and artificial intelligence capability.
1.5 Contribution
The paper makes three contributions. Theoretically, it extends the information-processing and complementary-assets accounts of IT value into the professional-services micro-enterprise, a setting in which the coordination burden falls on the same individuals who perform the revenue-generating work — a structural feature that amplifies the cost of architectural incoherence relative to larger organisations with dedicated operations functions. Methodologically, it demonstrates a transparent protocol for synthesising non-peer-reviewed commercial benchmark data while preserving analytical caution about its provenance. Practically, it supplies a diagnostic taxonomy and a dependency-ordered remediation sequence that firms and their advisors can apply directly.
2. Methodology and Data Sources
2.1 Research Design, Review Question, and Reporting Standard
This study is designed as a systematic secondary synthesis with a quantitative meta-aggregative component. It does not generate primary survey data. Its object is the body of large-sample benchmark evidence published on accounting practice technology during the 2026 cycle, which it aggregates, triangulates, and interprets against a formal taxonomy.
The review is organised around a single primary question and three subsidiary questions, specified before extraction commenced:
RQ. In small and mid-sized accounting practices, is the realisation of operational value from technology expenditure more closely associated with the integration coherence of the application portfolio than with the magnitude of that expenditure?
RQ1. What are the reported levels of software expenditure, application density, and integration status in the 2026 benchmark evidence, and how do they vary by firm tier and jurisdiction?
RQ2. What operational, economic, and workforce quantities are reported to co-occur with fragmented configurations?
RQ3. Where in a functional decomposition of the practice technology architecture do reported losses originate, as distinct from where they are experienced?
Framed in population–exposure–outcome terms, the population is the accounting or bookkeeping practice of 1–50 full-time equivalents in five common-law markets; the exposure is the composition and integration state of the application portfolio; the outcomes are expenditure, temporal loss, workforce strain, revenue leakage, pricing model, and advisory and artificial intelligence capability.
The design is meta-aggregative rather than meta-analytic in the strict statistical sense. The constituent datasets do not publish variance estimates, confidence intervals, item-level instruments, or respondent-level microdata, and their sampling frames are neither identical nor fully disclosed. Effect-size pooling, heterogeneity estimation ($I^2$), and formal publication-bias assessment are therefore not available. What the design does permit — and what it undertakes — is systematic extraction of reported point estimates, explicit attribution of each estimate to its source and sampling frame, identification of convergent and divergent findings across independent sources, appraisal of each source against a recognised grey-literature quality instrument, and structured interpretation against a theoretically motivated classificatory framework. This constitutes a synthesis of the best available evidence for the population under study, with the limitations of that evidence stated explicitly in Section 6.
Reporting follows the Preferred Reporting Items for Systematic Reviews and Meta-Analyses statement (PRISMA 2020; Page et al., 2021), adapted where the evidence base requires it. Three adaptations are material and are declared here rather than left implicit.
First, the corpus consists of industry benchmark publications and regulatory instruments rather than indexed academic studies, so bibliographic-database searching was supplemented by structured searching of producer and authority repositories, as set out in Section 2.3, and source appraisal follows grey-literature rather than clinical-trial conventions, as set out in Section 2.2.
Second, because the constituent datasets publish no dispersion statistics, the PRISMA items concerning effect-size synthesis and statistical risk-of-bias scoring cannot be completed in their standard form. Rather than declare the corresponding concerns inapplicable, this review substitutes instruments appropriate to the evidence base: AACODS appraisal (Section 2.6) in place of trial-level risk-of-bias scoring, and a three-level evidence confidence rating (Section 2.11) in place of GRADE certainty assessment. Both are reported in full.
Third, no review protocol was registered in advance. PROSPERO accepts only reviews containing at least one direct health-related outcome and is therefore not an eligible registry for this review (Pieper & Rombey, 2022); the appropriate generic destination is OSF Registries. The review is reported as unregistered, and the absence of prospective registration is recorded as a limitation in Section 6.1. The completed protocol, search log, and extraction records are deposited and available as described in Section 7.3.
2.2 Grey Literature: Operational Definition, Inclusion Rationale, and Appraisal Framework
The evidentiary core of this review is grey literature. Because the credibility of the entire synthesis rests on how that material is handled, the treatment is specified formally rather than left to the reader’s inference.
Operational definition. Grey literature is taken here in the sense adopted for management and organisational research by Adams, Smart and Huff (2017): the diverse and heterogeneous body of material made public outside traditional academic peer-review processes. The constituent datasets in this review are corporate research publications — large-sample practitioner surveys commissioned and published by software producers and, in one case, administered by an independent market-research agency. They are neither peer-reviewed nor indexed, and they are not vendor marketing collateral; the distinction is enforced by the eligibility criteria in Section 2.4 and by the protocol in Section 2.10.
Rationale for inclusion. Adams et al. (2017) identify the conditions under which grey literature inclusion is not merely defensible but necessary: where the phenomenon of interest is contemporary and fast-moving, where practitioner knowledge outpaces academic publication cycles, and where the peer-reviewed record does not address the population. All three conditions obtain. The technology posture of the sub-50-FTE accounting practice is not systematically surveyed in the peer-reviewed AIS literature; annual benchmark cycles report on the phenomenon at a cadence that academic publication cannot match; and excluding this material would not produce a more rigorous review but an empty one. The relevant methodological choice is therefore not whether to admit grey literature but how to appraise it, and the appraisal is specified below rather than assumed.
Tier classification. Sources are classified using the two-dimensional scheme proposed by Adams et al. (2017) and operationalised for systematic use by Garousi, Felderer and Mäntylä (2019), which locates grey material on axes of outlet control — the extent to which content is produced under explicit knowledge-creation criteria — and source expertise — the extent to which the producer’s authority and domain knowledge can be established. The scheme yields three tiers: first tier (high outlet control, high expertise: books, government reports, white papers, formal corporate research programmes); second tier (moderate: annual reports, news articles, presentations); and third tier (low: blogs, social media, correspondence).
This review admits first- and second-tier grey literature only. Third-tier material was excluded at the search-design stage and does not appear in the corpus. Tier assignments for each constituent dataset are reported in Table 1 and defended in Section 2.6.
Quality appraisal instrument. Each included dataset was appraised against the AACODS checklist (Tyndall, 2010), the standard instrument for grey-literature critical appraisal, which assesses Authority, Accuracy, Coverage, Objectivity, Date, and Significance. AACODS was selected in preference to trial-oriented risk-of-bias instruments because its dimensions map onto the actual failure modes of commercial benchmark research — undisclosed sampling frames, producer interest, and unstated content limits — whereas randomisation and blinding items have no referent here. Appraisal outcomes are reported in full in Table 1b (Section 2.6); no dataset was excluded on appraisal grounds, but appraisal outcomes feed directly into the confidence ratings assigned in Section 2.11.
Regulatory instruments. The nineteen statutory and regulatory instruments in the corpus are not grey literature in the sense above. They are primary legal sources issued by the authorities empowered to issue them, and are treated as authoritative statements of obligation rather than as evidence requiring credibility appraisal. They are, accordingly, the only element of the corpus carrying a high confidence rating in Section 2.11.
2.3 Search Strategy and Source Identification
Because the evidence base for practice technology is published predominantly outside the indexed academic literature, the search proceeded across four source streams rather than a single bibliographic database.
Stream 1 — Producer and industry research programmes. The published research and benchmarking programmes of accounting software producers and practice-technology vendors operating in the five markets under study were searched directly for benchmark reports fielded or published within the 2026 cycle.
Stream 2 — Professional bodies and industry associations. The research and publication repositories of the principal professional accountancy bodies in the five jurisdictions were searched for practice-management, technology-adoption, and firm-benchmarking surveys.
Stream 3 — Academic and business bibliographic databases. Scopus, Web of Science, Business Source Complete, and Google Scholar were searched for peer-reviewed and grey literature addressing the same constructs, principally to identify prior syntheses and to establish the theoretical anchors used in Section 1.2.
Stream 4 — Regulatory and statutory repositories. The official publication channels of the revenue, privacy, and cyber-security authorities of the five jurisdictions were searched directly for instruments imposing obligations that bear on practice technology architecture.
Search terms were combined across three concept groups using Boolean operators, adapted to the syntax of each interface: (a) population — “accounting practice”, “accounting firm”, “bookkeeping practice”, “tax practice”, “practice management”, “CPA firm”; (b) exposure — “technology stack”, “software spend”, “app sprawl”, “application sprawl”, “integration”, “automation”, “artificial intelligence”, “cloud accounting”, “engagement software”, “practice technology”; and (c) outcome — “benchmark”, “survey”, “productivity”, “scope creep”, “write-off”, “advisory services”, “value-based pricing”, “pricing model”. Regulatory searching used jurisdiction-specific instrument names in place of concept group (c).
The search was restricted to English-language material addressing the 2026 benchmark cycle, with prior-cycle editions retrieved only where required to establish year-over-year comparison. Reference lists of retrieved reports were hand-searched for additional qualifying sources, and the producer repositories in Stream 1 were monitored for late-cycle releases.
The search was executed between 1 July 2026 and 24 July 2026, and was rerun in full on 24 July 2026 to confirm currency prior to submission; no additional qualifying sources were identified on the rerun. The strategy is reproducible from the terms above, and the full search log — recording interface, date, term string, and yield for each execution — is retained by the author and available as described in Section 7.3.
2.4 Eligibility Criteria
Sources were included where they satisfied four criteria: (a) publication or fielding within the 2026 benchmark cycle; (b) a sampling frame consisting of accounting or bookkeeping practitioners or practices, rather than general small-business populations; (c) disclosure of at least a nominal sample size or population definition; and (d) reporting of quantitative point estimates on technology expenditure, application portfolio composition, operational workflow, engagement and billing behaviour, or artificial intelligence adoption.
Sources were additionally required to satisfy the grey-literature tier condition specified in Section 2.2: first- or second-tier material only, assessed on outlet control and source expertise. Third-tier material — practitioner blogs, social media commentary, forum discussion, and correspondence — was excluded irrespective of the quantitative content it reported.
Regulatory instruments were included where they were issued by a national revenue authority, national privacy regulator, or national cyber-security agency with jurisdiction over accounting practices in one of the five markets under study, and where they imposed obligations bearing directly on the design of a practice’s technology architecture.
Excluded were vendor product literature, pricing schedules, case studies, testimonial content, and any material presenting comparative product performance claims. This exclusion is material to the interpretive posture of the paper and is discussed further in Section 2.10.
2.5 Study Selection and Screening Outcome
Records retrieved across the four streams were de-duplicated, screened at title and summary level against the eligibility criteria in Section 2.4, and then assessed in full. Thirty-eight benchmark records were identified; ten duplicate or superseded editions were removed, leaving twenty-eight records for screening. Twenty-one were excluded at the title and summary screen, and seven proceeded to full-report assessment, of which four were excluded with reasons. Screening and full-report assessment were conducted by the sole author; no second reviewer was available, and the absence of dual independent screening is recorded as a limitation in Section 6.1. To partially mitigate single-reviewer risk, all full-report exclusion decisions were recorded against a named criterion in the review log, and the complete excluded-with-reasons list is retained and available on request.
Three quantitative benchmark datasets satisfied all inclusion criteria and constitute the empirical corpus. Nineteen regulatory and statutory instruments across the five jurisdictions satisfied the regulatory inclusion criterion. Two proprietary modelled instruments were additionally drawn upon; these were not identified through the systematic search and were not subject to eligibility screening, and are flagged as modelled at every point of use and shown outside the screening flow in Figure 1. The selection process is summarized in Figure 1.
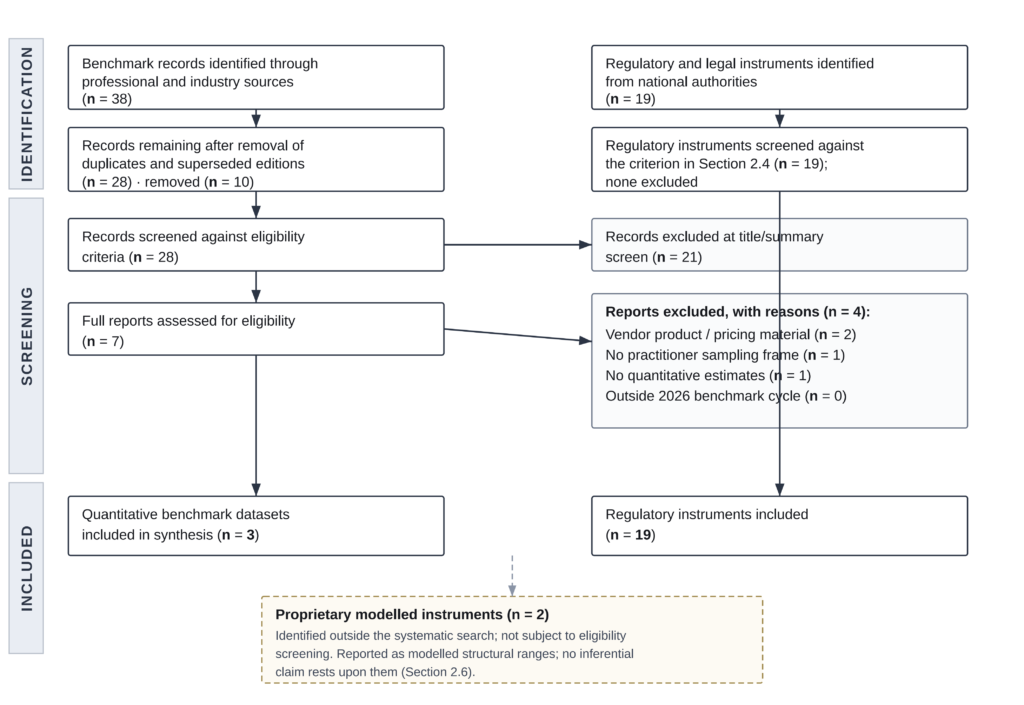
Figure 1. Study selection flow, following PRISMA 2020 conventions (Page et al., 2021) adapted for a benchmark-data evidence base. Records were identified across the four search streams described in Section 2.3 and screened against the eligibility criteria in Section 2.4, including the grey-literature tier condition specified in Section 2.2. Screening and full-report assessment were conducted by the sole author; the absence of dual independent screening is recorded as a limitation in Section 6.1, and all exclusion decisions are recorded against a named criterion in the review log. Regulatory and statutory instruments were identified and screened through a parallel stream (Section 2.3, Stream 4) and are shown separately, as they are primary legal sources rather than grey literature requiring credibility appraisal; all nineteen instruments identified met the inclusion criterion and none were excluded at screening. The two proprietary modelled instruments were identified outside the systematic search, were not subject to eligibility screening, and are shown outside the selection flow; their treatment and use constraints are specified in Section 2.6.
The largest single exclusion category at full-report assessment was vendor product and pricing literature, excluded under the criterion set out in Section 2.4 because it presents comparative performance and commercial claims rather than population estimates. This exclusion is what permits the manuscript to discuss named software as taxonomy membership without importing product advocacy, and it operates jointly with the protocol in Section 2.10.
2.6 Constituent Datasets, Tier Classification, and Source Appraisal
Three primary quantitative datasets, produced independently of one another and of the present author, constitute the empirical corpus. Table 1 records their provenance, scope, analytical role, and grey-literature tier; Table 1b reports their AACODS appraisal.
Table 1. Constituent benchmark datasets: provenance, scope, tier, and analytical role
| Dataset | Producer | Sample / scope | Jurisdictional frame | Tier | Domains contributed |
|---|---|---|---|---|---|
| Accountant Technology Survey | Intuit | n = 725 accounting professionals; fielded May 2026 | United States | 1st | Software expenditure; application density; integration status; time loss; workforce strain; onboarding duration; client digital readiness; AI adoption breadth and depth; advisory barriers |
| State of Client EngagementGlobal Report | Ignition, conducted with YouGov | Multi-market practitioner survey; sample size not disclosed at item level | United States, United Kingdom, Australia (comparative figures reported) | 1st | Unrecovered out-of-scope work; scope-conversation avoidance; proposal error frequency; collection behaviour and write-offs |
| State of the IndustryGlobal Benchmarks | Xero | Global practice benchmarking programme; sample size not disclosed at item level; sampling frame drawn from the producer’s connected practice base | Multi-market, Xero-connected practice base | 2nd | Client acquisition by service model; profitability by cloud posture; pricing-model transition |
Tier assignments follow the outlet-control / source-expertise scheme of Adams et al. (2017) as operationalised by Garousi et al. (2019). The Intuit instrument is classified first-tier on the strength of a disclosed sample size, a disclosed field date, a disclosed and bounded sampling frame, and a standing annual research programme. The Ignition instrument is classified first-tier on the strength of administration by an independent market-research agency, which raises outlet control above the level obtaining for producer-administered fieldwork notwithstanding the producer’s interest in the constructs measured. The Xero instrument is classified second-tier: the sampling frame is the producer’s own connected practice base, item-level sample sizes are not disclosed, and the resulting survivorship exposure is treated as material in Sections 2.11 and 6.1.
Table 1b. AACODS appraisal of constituent datasets (Tyndall, 2010)
| Criterion | Intuit Accountant Technology Survey | Ignition State of Client Engagement | Xero State of the Industry |
|---|---|---|---|
| Authority — producer standing, domain expertise, publication history | Met. Established producer; standing annual research programme; named publisher | Met. Established producer; fieldwork by an independent agency of known standing | Met. Established producer; standing global benchmarking programme |
| Accuracy — stated aims, disclosed method, verifiable data | Partially met. Sample size, field date, and frame disclosed; full instrument, item wording, and response distributions not published | Partially met. Fieldwork agency and multi-market design disclosed; item-level sample sizes and instrument not published | Partially met. Programme design described; item-level sample sizes, frame composition, and instrument not published |
| Coverage — content limits clearly stated | Met. United States frame explicitly stated by the producer | Partially met. Markets named; per-market composition not disclosed | Not met. “Global” scope asserted without disclosure of market composition or connected-base share |
| Objectivity — balance, detectable bias | Partially met. Producer’s products fall within categories measured; no comparative product claims made in the reported findings | Partially met. Producer’s product addresses the loss construct measured; independent administration mitigates but does not eliminate framing exposure | Not met on the profitability and acquisition items, where producer interest and the connected-base frame act in the same direction |
| Date — clearly stated, currency appropriate | Met. Fielded May 2026; within cycle | Met. Published within 2026 cycle | Met. Published within 2026 cycle |
| Significance — meaningful contribution given available alternatives | Met. Largest disclosed-npractitioner instrument available for the population; no peer-reviewed equivalent exists | Met. Only instrument in the corpus reporting unrecovered out-of-scope work across three national frames | Met. Only instrument in the corpus reporting pricing-model transition and service-model acquisition |
No dataset was excluded on appraisal grounds. Appraisal outcomes are carried forward into the confidence ratings assigned in Section 2.11; the Coverage and Objectivity results for the Xero instrument are the reason its findings carry the lowest confidence ratings in the corpus.
Two supplementary proprietary instruments produced by the research programme within which this study sits are also drawn upon and are identified as such at every point of use: the 2026 Firm-Tier Benchmarking Model, which provides the three-tier stratification and its associated expenditure, application-density, and scope-loss ranges; and the 2026 Regional Compliance Matrix, which consolidates ledger market-share estimates and mandatory compliance drivers by jurisdiction.
These instruments require a provenance statement that the tier and appraisal apparatus above does not supply, because they are neither third-party grey literature nor peer-reviewed sources: they are modelled instruments produced by the author’s own research organisation, and their derivation methodology is not externally published. Three constraints are therefore imposed on their use, and are observed without exception throughout the manuscript. They are reported as indicative structural ranges, never as measured population parameters. They are labelled modelled at every point of use, in body text, table cells, and figure notes alike. And no inferential claim, proposition test, or conclusion in this study rests on them, whether alone or in combination: every claim they appear in is independently supported by at least one third-party dataset in Table 1, and their function is to supply structure for stratified presentation rather than evidence for the propositions. Readers who discount them entirely will find no proposition in Section 3.8 unsupported as a result. The associated conflict-of-interest position is stated in Section 7.1.
2.7 Jurisdictional Scope and the Generalisability Constraint
The study covers five common-law, English-language markets with mature cloud-accounting ecosystems: the United States, Canada, the United Kingdom, Australia, and New Zealand. Regulatory context was drawn from the Internal Revenue Service and state departments of revenue (United States); the Canada Revenue Agency and Revenu Québec (Canada); His Majesty’s Revenue and Customs (United Kingdom); the Australian Taxation Office (Australia); and the Inland Revenue Department (New Zealand).
A constraint of first-order importance must be stated at the outset and is carried forward as an annotation on every relevant figure. The Intuit Accountant Technology Survey sampled United States practitioners only. Where its estimates are discussed alongside the four non-US markets, they are presented as indicative of profession-wide dynamics rather than as measured national benchmarks for those jurisdictions. The Ignition and Xero datasets carry genuinely multi-market frames and support cross-jurisdictional comparison within the limits of their own disclosure. Readers should not treat the five-market regulatory analysis in Section 4.11 as implying that all quantitative findings in Sections 4.1–4.10 are five-market estimates; they are not.
2.8 Unit of Analysis and Stratification
The unit of analysis is the accounting or bookkeeping practice, not the individual practitioner and not the client entity. Practices are stratified into three tiers by full-time-equivalent (FTE) headcount:
- Tier 1 — Solo Practitioner: 1 FTE
- Tier 2 — Small Practice: 2–10 FTEs
- Tier 3 — Mid-Sized Firm: 11–50 FTEs
This stratification is adopted because expenditure, application density, and the magnitude of realised losses each scale non-linearly with headcount, such that undifferentiated profession-level means obscure structurally distinct operating conditions. Practices above 50 FTEs are outside the frame of this study; their technology posture converges on enterprise IT patterns that the constituent datasets do not adequately sample.
Currency is reported in the denomination of the underlying source (USD, AUD, GBP) without conversion, since conversion at any single date would impose a spurious precision on estimates that are themselves reported as means or ranges.
2.9 Analytical Procedure
Extraction and analysis proceeded in six stages.
- Extraction. Every quantitative point estimate in the corpus was extracted verbatim with its source attribution, sampling frame, and jurisdictional applicability recorded as metadata.
- Normalisation. Estimates were normalised to a common vocabulary — expenditure, application density, integration status, temporal loss, workforce strain, revenue leakage, adoption depth — to permit comparison across instruments that use divergent terminology for equivalent constructs.
- Triangulation. Where two or more independent datasets addressed a common construct, convergence and divergence were recorded. Convergent findings are afforded greater interpretive weight in Section 5; single-source findings are identified as such and rated accordingly under Section 2.11.
- Classification. Each finding was mapped to the zone or zones of the functional taxonomy defined in Section 3, permitting analysis of where in the architecture observed losses originate as distinct from where they are experienced.
- Confidence rating. Each principal finding was assigned an evidence confidence rating under the rules specified in Section 2.11, applied uniformly and before interpretation.
- Regulatory overlay. Jurisdictional mandates were mapped against the taxonomy to identify where compliance obligation constrains architectural choice.
2.10 Protocol for the Treatment of Commercial Software Instances
Because practice technology is discussed in the source literature almost entirely by vendor name, a formal protocol was adopted to permit analysis without lapsing into product evaluation.
Named commercial software products appear in this manuscript solely as representative instances populating a functional category within the taxonomy. Their inclusion denotes observed presence and market position within a jurisdictional or firm-tier configuration as reported in the underlying benchmark sources. It does not constitute endorsement, recommendation, or comparative performance assessment.
Specifically, and without exception: no product performance claim is advanced; no comparative benchmarking between named products is presented; no pricing comparison is made; no hands-on testing was conducted by the author; and no vendor supplied, reviewed, funded, or influenced this analysis. Where the source literature framed a product prescriptively, that framing has been converted to descriptive taxonomy membership. Where a firm-tier configuration is described, it should be read as an empirical observation of what configurations are typically found at that tier, not as a prescription of what a firm at that tier ought to purchase.
This protocol is the mechanism by which a body of commercially originated evidence is rendered analytically usable. It operates jointly with the tier classification and AACODS appraisal in Sections 2.2 and 2.6, which govern the credibility of the sources, and with the provenance rule in Section 2.11, which governs the weight assigned to their findings. Its adequacy is revisited in Section 6.
2.11 Provenance-Interest Appraisal and Evidence Confidence Rating
Two of the three constituent datasets are produced by commercial vendors whose products fall within the functional categories being measured. This creates a structural interest in the direction of certain findings: an engagement-platform producer measuring the cost of unrecovered out-of-scope work, and a cloud-ledger producer measuring the profitability of cloud-first practices, each report on a construct their product is positioned to address.
This review does not treat that interest as disqualifying, and it does not treat it as immaterial. It treats it as a measurable property of each finding, appraised under a rule specified before extraction rather than as a caveat appended after interpretation. Every principal finding was rated against three criteria:
- Independent corroboration. Is the construct reported by two or more independently produced datasets (triangulated), or by one (single-source)?
- Producer-interest alignment. Does the direction of the finding align with the producer’s commercial interest (aligned), or is it orthogonal to or against that interest (orthogonal)?
- Frame correspondence. Does the sampling frame of the source match the scope of the claim the finding is used to support (frame-matched), or is the claim extended beyond the disclosed frame (frame-extended)?
Ratings are assigned as follows. High — triangulated or primary-source, orthogonal, frame-matched. Moderate — single-source, orthogonal, frame-matched; or triangulated with aligned interest. Low — single-source with aligned producer interest, or any finding drawn from a frame with known survivorship exposure, or any frame-extended claim.
Applied to the corpus, the ratings are: the nineteen regulatory instruments, high; the Intuit expenditure, application-density, integration-status, workforce-strain, onboarding, client-digital-readiness, and advisory-barrier findings, moderate; the Intuit productivity-tax and artificial-intelligence findings, moderate, with the caution that both concern constructs the producer’s product addresses; the Ignition scope-leakage, avoidance, proposal-error, and collection findings, moderate, the cross-jurisdictional consistency of the leakage benchmark across three independent national frames being difficult to attribute to instrument design alone; and the Xero profitability and client-acquisition findings, low, on the joint grounds of aligned producer interest and a connected-base sampling frame carrying survivorship exposure in the same direction. The Xero pricing-transition finding is rated moderate, the direction of that finding being orthogonal to the producer’s interest.
The practical consequence, stated so that readers may apply it consistently, is that the discount warranted by producer interest should be applied specifically to the profitability, client-acquisition, and leakage magnitudes, and not uniformly across the corpus. The findings on which the central argument of this paper depends — integration status, temporal loss, workforce strain, and the data-readiness barrier — are drawn predominantly from the corpus segment where producer interest is orthogonal to the direction of the result. This asymmetry is material to the interpretation offered in Section 5 and is revisited in Section 6.2.
2.12 Use of Artificial Intelligence Tools in the Review Process
In accordance with the disclosure expectations of preprint servers and journals, the use of artificial intelligence tools in the conduct and preparation of this review is documented here as part of the method rather than solely in the declarations.
Large language model tools were used for editorial and formatting purposes: language editing, structural organisation of the manuscript, consistency checking of terminology across sections, and preparation of tables and reference formatting. No large language model was used to identify or select sources, to extract or compute quantitative estimates, to generate the theoretical framework or its propositions, or to draw analytical conclusions. Every quantitative value reported in Section 4 was extracted by the author directly from the constituent source documents and verified against them.
No large language model is listed as an author, consistent with the principle that authorship entails accountability that cannot be attributed to such a system. The author accepts full responsibility for the integrity, accuracy, and originality of all content presented, including any portion that received editorial assistance.
2.13 Methodological Cautions Applied Throughout
Four cautions are applied consistently in the analysis that follows and should be borne in mind when reading it.
First, all constituent datasets are self-reported practitioner surveys and are therefore subject to social desirability, recall, and non-response bias. The direction of social-desirability bias is not neutral: admissions of fragmentation, avoidance behaviour, and write-off practice are the items most plausibly under-reported, which implies that the losses documented in Section 4 are more likely understated than overstated.
Second, two of the three producers are commercial vendors of accounting software whose products fall within the categories being measured. The appraisal rule and confidence ratings in Section 2.11 govern how this is carried into interpretation; the broader implications are examined in Section 6.2.
Third, all reported associations are cross-sectional and correlational; no causal inference is warranted by the data, and the directional language used in the source literature has been neutralised accordingly. Where the framework offers a mechanism connecting two associated quantities, that mechanism is advanced as an interpretation consistent with the evidence, not as an identified effect.
Fourth, no dataset publishes dispersion statistics, so all central-tendency figures reported below should be read as point estimates of unknown precision. Where a figure is described as a mean, the underlying distribution is unknown and may be materially skewed; the possibility that a small number of high-loss practices drives a reported mean cannot be excluded from any figure in this study.
3. Theoretical Framework: The 4-Zone Functional Architecture
3.1 Rationale for a Functional Taxonomy
Analysis of practice technology by vendor is analytically unstable across the dimensions this study cares about. Vendor dominance varies sharply by jurisdiction, so a vendor-indexed description of a United States practice is not commensurable with one of a New Zealand practice performing the identical functions. Vendor scope also varies over time and by tier, as platforms absorb adjacent functions. And vendor-indexed description obscures the object of theoretical interest, which is not which product a firm has purchased but which functions it has instrumented and how those functions exchange data.
The 4-Zone Functional Architecture addresses this by classifying every application in a practice according to the function it performs within the client lifecycle, and by specifying the dependency relations between those functions. It is a taxonomy with an ordering relation: the zones are not merely categories but a directed sequence in which each zone consumes the output of its predecessor.
The architecture comprises four value zones (Zones 1–4), which trace the client lifecycle from acquisition to advisory delivery, resting on a substrate zone (Zone 0) that supplies the utilities all four consume. The nomenclature — a four-zone architecture with five named zones — is deliberate and reflects an analytical distinction rather than an inconsistency: Zones 1 through 4 constitute the value-creating sequence and are the architecture proper, while Zone 0 is designated by zero rather than by five to encode its position beneath the sequence rather than after it. It is the first requirement of a practice, not the last, and its failure modes are categorically different from those of the value zones, as Section 3.2 sets out.
3.2 Zone 0 — The Substrate: Identity, Resilience, Connectivity, and Institutional Knowledge
Zone 0 comprises the utility layer on which the four value zones silently depend. It is defined by six functions: identity and access management (authorisation and authentication across systems); data resilience (recoverability from deletion, corruption, or malicious encryption); connectivity (client communication under a controlled institutional identity); integration (movement of data between applications lacking native connections); institutional knowledge(documentation and transfer of process); and outbound domain identity (deliverability and impersonation resistance of the practice’s electronic correspondence).
Zone 0 is theoretically distinct from the value zones on two grounds. First, its dependency relation is asymmetric and total: every value zone consumes Zone 0 services, and Zone 0 consumes none of theirs. Second, its failure modes are non-proportional. A suboptimal selection within Zones 1 through 4 degrades efficiency, margin, or growth, and is remediable by migration. A Zone 0 failure — unrecoverable data loss, credential compromise exposing client tax data, or domain impersonation enabling payment redirection — is capable of terminating the practice through regulatory penalty, loss of electronic filing authorisation, or reputational collapse in a service whose entire value proposition is fiduciary trustworthiness.
A further property distinguishes Zone 0 empirically: it produces no client-visible deliverable and appears on no engagement letter, which is the structural reason it is systematically under-budgeted and typically instrumented only after an adverse event. This under-instrumentation is not a failure of practitioner judgement so much as a predictable consequence of a zone whose successful operation is, by construction, invisible.
Representative commercial instances within Zone 0 categories, as observed in the source literature, include credential-vaulting and secrets-management platforms; cloud-ledger backup and point-in-time restoration services; dedicated business telephony platforms; visual workflow-automation middleware; process-documentation and onboarding platforms; and domain registration and DNS management services. These are enumerated as taxonomy exemplars under the protocol in Section 2.10.
A conceptual point specific to this zone warrants formal statement because it is widely misapprehended in practice. Cloud ledger platforms provide infrastructure redundancy — continuity of service and data survival across hardware, data-centre, or regional failure. They do not, as a standard feature, provide user-error resilience — the capacity of an individual practice to restore its own file to a prior state following its own destructive action. Redundancy faithfully replicates every change a firm makes, including erroneous ones. The distinction constitutes a shared-responsibility gap: the platform provider secures the platform; the practice remains responsible for the integrity of the data within it. This gap is a Zone 0 obligation, and its salience is amplified by the workforce-strain findings reported in Section 4.5, since fatigued personnel operating across a fragmented portfolio constitute precisely the population most likely to execute a destructive action in an incorrect client file.
3.3 Zone 1 — Front Office: Attract, Qualify, Schedule, Capture
Zone 1 is the demand-generation and intake function. Its four sub-functions are attract (demand generation and lead acquisition), qualify (filtering prospects for engagement fit), schedule (converting expressed interest into a committed appointment), and capture (collection of the information required to scope an engagement).
Its theoretical significance is disproportionate to its share of expenditure because it occupies the apex of the revenue funnel: its conversion rate operates as a multiplier on every downstream zone. A marginal improvement in intake conversion is not a marginal marketing gain but a proportional increase in the raw input that the entire remaining architecture processes into revenue.
Zone 1 is also where the client digital-readiness divide documented in Section 4.8 first becomes an architectural constraint, since the zone must serve a self-service digital cohort and a high-touch manual cohort through a single funnel. Representative instances include website and hosting platforms, automated scheduling systems, and customer relationship management platforms.
3.4 Zone 2 — Mid-Office: Scope, Engage, Collect, Recover
Zone 2 is the governance layer between acquisition and production. Its four sub-functions are scope (definition of the boundary of the engagement), engage (execution of a binding engagement instrument), collect (securing payment), and recover (capturing fees for work exceeding original scope).
This zone is where a practice’s realised economics are determined. Two practices performing an identical volume of client work may differ substantially in revenue realisation depending solely on Zone 2 governance quality. The construct scope leakage — the divergence between delivered professional value and realised revenue — is defined at this zone and quantified in Section 4.6. Representative instances include proposal and engagement-execution platforms, electronic signature infrastructure, and profession-specific payment processing services.
3.5 Zone 3 — Back Office: Ledger, Workflow, Capture, Payroll, Compliance
Zone 3 is the production function: general ledger maintenance, workflow orchestration, document and receipt digitisation, accounts payable, payroll, and tax preparation and filing. It is the most application-dense zone in every firm tier and, consequently, the principal locus of application sprawl.
Zone 3 possesses a property no other zone shares: its architecture is partly dictated by statute. What a practice must file, in what format, and on what cadence is determined by the national revenue authority, and these mandates constrain which configurations are viable. Zone 3 is therefore the zone at which the universal structure of the taxonomy meets irreducibly regional execution, analysed in Section 4.11. Representative instances include cloud general ledgers, practice-management and workflow platforms, document-capture and optical character recognition services, and jurisdiction-specific payroll engines.
The theoretically central claim regarding Zone 3 is that its integration state, rather than its tool quality, determines the practice’s advisory ceiling — a claim tested in Sections 4.9 and 5.4.
3.6 Zone 4 — Advisory and Artificial Intelligence: Analyse, Forecast, Advise
Zone 4 converts compliance-grade data into advisory-grade insight. Its functions are business intelligence, financial planning and analysis, forecasting, client-facing dashboards, and AI-assisted research and automation. It is the smallest zone by application count and the largest by economic consequence, since it determines the ceiling on revenue per client: compliance output has a price anchored to the labour required to produce it, whereas advisory output is priced against client-perceived value and has no equivalent anchor.
Artificial intelligence occupies an anomalous position in the taxonomy. Empirically it is instrumented as a Zone 4 capability, but functionally it operates horizontally across all zones — intake triage in Zone 1, proposal drafting in Zone 2, transaction classification in Zone 3, and analytical synthesis in Zone 4. The framework therefore treats AI as both a zone-resident capability and a horizontal substrate, a dual classification that is theoretically necessary because AI’s returns are governed by the integration state of the zones it traverses rather than by the sophistication of the AI instrument itself.
3.7 Taxonomy Summary
Table 2. The 4-Zone Functional Architecture: functions, constructs, and dependency relations
| Zone | Designation | Primary functions | Central construct | Consumes | Failure mode |
|---|---|---|---|---|---|
| 0 | Substrate | Identity and access; data resilience; connectivity; integration middleware; institutional knowledge; domain identity | Shared-responsibility gap | — | Non-proportional; potentially terminal |
| 1 | Front Office | Attract; qualify; schedule; capture | Client digital-readiness divide | Zone 0 | Demand attrition at funnel apex |
| 2 | Mid-Office | Scope; engage; collect; recover | Scope leakage | Zones 0–1 | Realised revenue below delivered value |
| 3 | Back Office | Ledger; workflow; document capture; payroll; tax compliance | Application sprawl | Zones 0–2 | Productivity tax; compliance exposure |
| 4 | Advisory and AI | Business intelligence; FP&A; forecasting; AI research | Data readiness barrier | Zones 0–3 | Unreliable analytical output |
Table 2b. Correspondence between theoretical anchors, empirical findings, and propositions
| Theoretical anchor (§1.2) | Construct | Principal empirical finding (§4) | Proposition | Confidence (§2.11) |
|---|---|---|---|---|
| Productivity paradox (Brynjolfsson, 1993; Brynjolfsson & Hitt, 1998) | Investment–realisation gap; complementary organisational change | Expenditure USD 21–22k against ~19k prior cycle, with 48% fragmented (§4.1, §4.3) | P1 | Moderate |
| Information-processing view (Galbraith, 1974) | Structure–load correspondence | 41% fully integrated vs 48% fragmented (§4.3) | P1 | Moderate |
| Coordination cost (Malone & Crowston, 1994) | Residual coordination borne by human actors | Productivity tax: 5 h per employee per week (§4.4) | P1 | Moderate |
| Task–technology fit (Goodhue & Thompson, 1995) | Fit as correspondence, not endowment | Density mean of 10 uninformative as to maturity (§4.2); 88% scope-conversation avoidance (§4.7); 53/47 client digital-readiness divide (§4.8) | P2, P4 | Moderate |
| Data quality and downstream use (Wang & Strong, 1996) | Fitness of data for its consuming purpose | Manual data cleanup named principal advisory barrier by 30%, ahead of staffing 24% and app overload 16% (§4.9) | P3 | Moderate |
| Absorptive capacity (Cohen & Levinthal, 1990) | Capacity to assimilate and exploit external knowledge | 56% report six-month-plus onboarding ramp (§4.5); AI depth divergence, 30% embedded vs 54% situational (§4.9) | P3, P5 | Moderate |
| Enterprise systems integration (Davenport, 1998; Markus & Tanis, 2000) | Integration as an organisational rather than technical achievement | Fragmentation concentrated in Zone 3, the most application-dense zone (§4.3) | P1, P3 | Moderate |
| IT business value; complementary resources (Melville et al., 2004) | Technology asset inert without complementary organisational resource | Superlinear expenditure scaling with headcount (§4.1, §4.10); 32% pricing transition among growing practices (§4.9) | P1, P4 | Moderate |
| Regulatory determination of architecture (statutory instruments, §4.11–4.12) | Compliance obligation as architectural constraint | Nineteen instruments across five markets converging on continuous, interface-driven filing and a common Zone 0 control set | P5 | High |
3.8 Propositions
The framework yields five propositions, each stated with a specified direction, a candidate operationalisation, and a falsification condition. Each is addressed against the evidence in Section 4 and discussed in Section 5. Because the present evidence base is cross-sectional and correlational (Section 2.13), the propositions are advanced as testable claims for subsequent research rather than as hypotheses tested here; Section 6.4 specifies the designs that would test them.
P1 (Coherence over magnitude). Integration coherence — the proportion of inter-application data transfers occurring without human intervention, frequency-weighted — is more strongly associated with operational outcomes (temporal loss, workforce strain, realised margin) than is annual technology expenditure, and the association between expenditure and outcomes is conditional on coherence rather than direct. Falsified if: expenditure magnitude predicts operational outcomes at equal or greater strength than coherence once firm tier is controlled, or if the expenditure–outcome relationship is invariant across levels of coherence.
P2 (Density is not sophistication). Application count is not monotonically associated with architectural maturity or with operational outcomes; conditional on integration coherence, the partial association between application count and operational outcome is indistinguishable from zero. Falsified if: application count retains an independent association with operational outcomes after coherence is controlled, in either direction.
P3 (Directional dependency). The analytical reliability achievable in Zone 4 is bounded above by the integration coherence of Zone 3. Advisory and analytical capability will therefore be observed to increase with Zone 4 instrumentation only among practices whose Zone 3 coherence exceeds a threshold, and to be approximately flat in Zone 4 instrumentation below it. Falsified if: practices with low Zone 3 coherence realise advisory outcomes from Zone 4 instrumentation comparable to those realised by high-coherence practices — that is, if the interaction between Zone 3 coherence and Zone 4 instrumentation is null.
P4 (Pricing complementarity). Under time-based billing, efficiency gains realised in Zones 2 and 3 are partially converted into revenue reduction, attenuating their margin effect; under value-based or fixed-fee pricing, the same gains accrue to margin. The margin return to Zone 2 and Zone 3 efficiency is therefore moderated by pricing model, and the two are complementary rather than independent decisions. Falsified if: the margin return to Zone 2 and Zone 3 efficiency is statistically indistinguishable across pricing models, or if value-based pricing adopted without corresponding scope-governance instrumentation yields margin gains equivalent to the two adopted jointly.
P5 (Substrate primacy). Zone 0 maturity is a precondition of value-zone performance rather than a supplement to it, and its failure distribution is non-proportional: the severity distribution of Zone 0 failures is right-skewed relative to that of Zones 1–4, containing a tail of practice-terminating outcomes with no counterpart in the value zones. Falsified if: the observed severity distribution of substrate failures is comparable to that of value-zone failures, or if practices with low Zone 0 maturity achieve value-zone outcomes comparable to those of high-maturity practices at equivalent instrumentation.
4. Empirical Findings and Analysis
This section reports the synthesised findings. Each subsection identifies the contributing dataset and its sampling frame. Findings derived from the United States practitioner survey are marked as such and should not be read as measured estimates for the four non-US markets, per Section 2.7.
4.1 Software Expenditure
Mean annual practice software expenditure was reported at USD 21,000–22,000, against a prior-cycle baseline of approximately USD 19,000 — a double-digit percentage increase within a single benchmark year (Intuit, 2026; US frame).
Read in isolation, this trajectory is consistent with a profession modernising with confidence. Read against the composition and integration findings that follow, it supports a different reading: expenditure growth is occurring without a corresponding growth in architectural coherence. The relevant analytical distinction is between spending more and spending more coherently, and the evidence assembled here indicates that the profession is doing the former substantially faster than the latter.
Expenditure scales non-linearly with headcount. The firm-tier model places the Solo Practitioner at USD 2,500–6,000 annually, the Small Practice at USD 15,000–35,000, and the Mid-Sized Firm at USD 50,000–150,000 or more (VerityLoft Research, 2026a; modelled ranges). A Tier 3 practice may carry approximately five times the headcount of a Tier 2 practice at the upper bound while carrying ten times or more the software budget — a superlinearity attributable to the enterprise-grade practice management, security, and integration middleware required to hold a larger portfolio together. The integration burden, in other words, is itself a scaling cost, and it grows faster than the workforce it serves.
In the terms of the resource-based treatment of IT business value (Melville et al., 2004), the expenditure figure measures the acquisition of a technology resource but is silent on the complementary organisational resources required to convert it. The superlinearity observed across tiers is the first indication in the data that the complementary resource — integration capability — is itself a cost that scales, and scales faster than the asset it serves. This is the empirical entry point to P1.
4.2 Application Density and the Sprawl Construct
Practices reported operating a mean of ten distinct software applications, with one in three operating between eleven and twenty-five or more (Intuit, 2026; US frame). Modelled density by tier is 4–6 applications at Tier 1, 8–12 at Tier 2, and 12–18 or more at Tier 3 (VerityLoft Research, 2026a).
The mechanism generating this density is important to the theoretical account, because it is not irrational acquisition. Each application enters the portfolio to resolve a discrete and genuine operational problem — appointment scheduling to eliminate telephone latency, receipt capture to eliminate manual document handling, proposal automation to accelerate engagement execution. Every individual acquisition is defensible on its own terms. The pathology is emergent rather than decisional: it resides in the aggregate, and specifically in the interfaces between instruments that no individual purchasing decision was responsible for evaluating.
This supports P2. Density is not a proxy for sophistication. A Tier 1 portfolio of four to six natively integrated instruments frequently represents a more coherent architecture than a Tier 2 portfolio of twelve poorly interfaced ones. The analytically relevant variable is not the count of applications but the proportion of inter-application data transfers that occur without human intervention.
Read through task–technology fit (Goodhue & Thompson, 1995), the density finding is theoretically silent by construction: fit is a property of the correspondence between task requirements and technology functionality, and no count of instruments carries information about correspondence. A portfolio of four well-fitted, natively connected applications and a portfolio of twelve poorly interfaced ones are equidistant from the profession mean and nowhere near each other in fit. This is the substance of P2, and the reason application count is rejected here as a maturity proxy.
4.3 Integration Status
Integration status is the pivotal variable of this study. Reported distribution was: 41% fully integrated, with applications exchanging data automatically; 48% fragmented, requiring manual export, reformatting, and re-entry between systems (Intuit, 2026; US frame). The residual proportion is not characterised in the source instrument.
The distance between these two populations is the distance between technology functioning as leverage and technology functioning as friction. It is, in the terms of Section 1.2, the distance between an information system that absorbs coordination load and one that generates it (Galbraith, 1974; Malone & Crowston, 1994).
Fragmentation is concentrated in Zone 3, where the widest variety of distinct functions coexists and where the largest number of inter-system transfers must occur. A practice assembling a best-of-category Back Office can accumulate five or six applications in that zone alone — approaching, on its own, the ten-application profession mean.
The 41/48 split is therefore best understood as a partition of the population by information-processing capability rather than by technology endowment. Both groups have purchased capable software; they differ in whether their structure processes the information load their task portfolio imposes (Galbraith, 1974), or displaces that load onto human actors. Integration status is the study’s operationalisation of the moderator proposed in Section 5.2 and is the variable on which P1 turns.
4.4 The Productivity Tax
The operational cost of fragmentation is measured directly. Staff lose a mean of five hours per employee per week to manual data re-entry, comma-separated-value export, and cross-system reconciliation (Intuit, 2026; US frame). This study designates the quantity the productivity tax.
The aggregate is non-trivial. For a ten-person practice, five hours per employee per week is fifty hours weekly — in excess of one full-time equivalent’s capacity — consumed not by client service but by the mechanical transport of data between systems that do not exchange it natively. Expressed against a nominal 40-hour week, the tax represents approximately 12.5% of available labour capacity.
Three properties of this quantity warrant emphasis. It is recurrent, accruing every week rather than at a single migration event. It is invisible to the income statement, appearing in no expense line and therefore escaping the ordinary mechanisms of managerial cost control. And it is concentrated in the zone whose output all downstream analysis depends on, which is the mechanism linking it to the advisory findings in Section 4.9.
Five hours per employee per week is, in information-processing terms, a direct measure of residual coordination cost (Malone & Crowston, 1994) — the coordination that the technology was acquired to eliminate, relocated to human actors rather than removed. Its theoretical significance is that it is the mechanism by which the productivity paradox (Brynjolfsson, 1993) is realised at practice level: expenditure rises, capability rises, and realised output does not, because the increment is consumed at the interfaces. This finding, together with Section 4.3, constitutes the principal evidence for P1.
4.5 Workforce Strain and Onboarding Duration
The productivity tax co-occurs with substantial workforce strain. Ninety percent of practices reported employee fatigue or burnout; of that reported strain, 25% was attributed to fragmented data and 37% to billable volume (Intuit, 2026; US frame). Separately, 56% reported that entry-level hires require six or more months to reach full productivity (Intuit, 2026; US frame).
These findings describe a reinforcing cycle rather than three independent problems. Fragmentation consumes capacity through the productivity tax; the resulting capacity deficit intensifies billable-volume pressure on existing staff; the strain that follows degrades the capability of the workforce that might otherwise absorb the additional load; and the extended onboarding duration prevents the practice from hiring its way out, because each additional disconnected application is another instrument a new entrant must master before contributing.
The onboarding finding admits a specific interpretation supported by the framework. A substantial share of the six-month ramp is plausibly consumed not by acquiring professional accounting judgement — which is genuinely slow to develop — but by acquiring firm-specific institutional knowledge: which of ten applications serves which purpose, local file-naming conventions, month-end close sequence, client-specific handling exceptions, and credential location. This is Zone 0 institutional-knowledge content. Where it is undocumented, it exists only in the working memory of incumbent staff, and its transfer diverts those staff from billable work — which feeds directly back into the 37% of strain attributed to billable volume. Undocumented process, on this reading, taxes the experienced team twice.
The onboarding finding admits an absorptive capacity reading (Cohen & Levinthal, 1990). A six-month ramp in a professional context where the technical accounting knowledge is credentialed on entry indicates that the binding constraint is the assimilation of firm-specific, undocumented architectural knowledge — which of ten applications serves which purpose, and how data moves between them. Absorptive capacity is thereby shown to be depressed by the same architectural condition that generates the productivity tax, and both are Zone 0 institutional-knowledge failures before they are staffing problems. This is corroborative evidence for P5.
4.6 Scope Leakage
Scope leakage is the largest single quantified loss in the corpus and the finding with the strongest cross-jurisdictional support.
Table 3. Unrecovered out-of-scope work by jurisdiction and by modelled firm tier
Panel A — Reported estimates (third-party benchmark data; confidence: moderate, per Section 2.11)
| Frame | Reported mean annual unrecovered out-of-scope work | Source |
|---|---|---|
| United States (per practice) | USD 76,636 | Ignition, 2026 |
| Australia (per practice) | In excess of AUD 90,000 | Ignition, 2026 |
| United Kingdom (per practice) | GBP 69,957 | Ignition, 2026 |
Panel B — Modelled structural ranges (author-produced instrument; indicative only, not measured parameters; see Section 2.6)
| Firm tier | Modelled annual unrecovered out-of-scope work | Source |
|---|---|---|
| Tier 1 — Solo Practitioner | USD 5,000–15,000 | VerityLoft Research, 2026a (modelled) |
| Tier 2 — Small Practice | USD 35,000 up to the USD 76,636 benchmark | VerityLoft Research, 2026a (modelled) |
| Tier 3 — Mid-Sized Firm | In excess of USD 100,000 | VerityLoft Research, 2026a (modelled) |
Two observations follow. First, the appearance of comparable mid-five-figure losses across three independent national markets indicates a structural feature of the professional-services engagement model rather than a jurisdictional anomaly. Second, and consequentially for the economic argument in Section 5.3, the Tier 2 leakage estimate meets or exceeds the entire Tier 2 annual software budget across all four value zones. The loss is larger than the total instrumentation cost of the architecture that would address it.
Leakage originates in an identifiable three-stage sequence: imprecise scope definition at engagement, leaving the boundary of the work undefined; undetected scope expansion, in which cumulative incremental client requests cross that boundary without any system registering the drift; and non-recovery, in which the practice, having performed the additional work, declines to bill it.
Scope leakage is the study’s clearest instance of a loss that is invisible to the information system precisely because no system spans the boundary at which it occurs. In information-processing terms (Galbraith, 1974), the practice has no mechanism registering the divergence between committed and delivered scope, so the divergence accumulates without generating a signal. The finding that the Tier 2 leakage estimate meets or exceeds the entire Tier 2 software budget is the empirical basis for the economic argument in Section 5.3 and bears directly on P4.
4.7 Behavioural Mechanisms in Fee Recovery
The third stage of the leakage sequence is behavioural rather than technical, and the data on this point is among the most striking in the corpus. Eighty-eight percent of practices reported delaying or avoiding scope conversations with clients, and 43% reported simply absorbing the cost of out-of-scope work rather than raising it (Ignition, 2026).
This finding reframes the leakage construct. Practices do not principally lose USD 76,636 annually because they lack the technical capability to invoice for additional work; they lose it because they decline to initiate the interaction that would generate the invoice. The out-of-scope request characteristically arrives mid-relationship, from a client the practice values. Raising a fee at that moment is experienced as confrontational; absorption is experienced as relationship management. Aggregated across a client portfolio and a year of small expansions, an individually reasonable interpersonal instinct compounds into the observed loss.
The theoretical implication is that the operative value of engagement automation in Zone 2 is not efficiency but depersonalisation of the fee conversation. Where a scope change automatically generates a revised engagement instrument that the client approves through the same mechanism used at initial engagement, the fee adjustment ceases to be an interpersonal negotiation and becomes a system-mediated transaction. This is a substitution of process for interpersonal exposure, and it addresses the 88% directly in a way that additional billing functionality does not.
A parallel mechanical failure compounds the behavioural one: 88% of practices reported manual proposal or engagement-letter errors occurring two to three times per month (Ignition, 2026). At that frequency the phenomenon is not occasional lapse but systematic defect in a manual document-assembly process — the predictable output of duplicating a prior client’s instrument, editing fields by hand, and relying on human vigilance for consistency. Each such error either under-charges, misstates the agreed deliverable, or requires a correction cycle that delays execution.
The 88% avoidance figure is where task–technology fit (Goodhue & Thompson, 1995) does analytical work that a pure capability account cannot. The practices in question possess the technical capability to invoice; the fit failure is between the task as actually performed — a socially costly interpersonal negotiation — and the technology as designed — a billing function presupposing that the negotiation has already concluded. This is why interventions adding billing functionality should be predicted to underperform interventions restructuring the interaction, and it generates the directly testable claim set out in Section 6.4.
4.8 Collection Behaviour and Client Digital Readiness
Collection. Ninety-four percent of practices reported chasing late payments; invoices ran a mean of thirty days overdue; and 38% reported writing off invoices entirely to avoid client friction (Ignition, 2026).
The write-off figure is the collection-side analogue of the scope-conversation finding. In both cases the practice exchanges realised revenue for interpersonal comfort — 43% absorbing out-of-scope work, 38% forgoing legitimate invoiced amounts. The thirty-day mean imposes a further compounding cost beyond the write-offs, since it obliges the practice to finance its own operations through the collection interval and consumes staff time in recurrent low-value pursuit.
Client digital readiness. The client base divides at 53% tech-advanced or proficient and 47% tech-limited or challenged (Intuit, 2026; US frame). This near-parity is the single most consequential design constraint on client-facing zones, because it obliges practices to operate parallel digital and manual workflows simultaneously.
The constraint operates at both ends of the architecture. In Zone 1, a purely self-service intake funnel converts the proficient cohort while attriting the tech-limited one, and a purely high-touch funnel does the inverse. In Zone 4, the proficient cohort will engage an interactive dashboard as a deliverable, while a substantial portion of the tech-limited cohort will not open it at all, requiring advisory value to be delivered through guided narrative interpretation. The analytical error the framework identifies here is the conflation of the instrument with the service: the dashboard is the instrument, the interpretation is the service, and for nearly half the client base the service must be delivered through human narrative regardless of the instrument’s quality.
The digital-readiness divide is a task–technology fit constraint operating on the client side of the boundary (Goodhue & Thompson, 1995), and it is the reason a single-pathway architecture cannot be optimal at either end of the taxonomy: any instrument fitted to one cohort is, by construction, misfitted to the other. The framework’s identification of the instrument–service conflation follows from this directly.
4.9 Advisory Economics, Pricing Transition, and Artificial Intelligence
Advisory and acquisition. Practices offering client advisory services (CAS) added 75% more net-new clients annuallythan compliance-only practices — a mean of 58 new clients per year against 33 (Xero, 2026).
This is the most counterintuitive finding in the corpus, because it inverts the conventional assumption that advisory services principally raise revenue per existing client. The data indicates that they also materially accelerate acquisition of new clients, plausibly because advisory relationships generate referral and retention dynamics that transactional compliance engagements do not.
Profitability and cloud posture. Cloud-first practices reported year-over-year profit surges at a rate of 75%, against 54%for non-cloud practices (Xero, 2026). The association is cross-sectional and no causal direction is established by the data; a plausible mechanism, consistent with the framework, is that cloud ledgers supply the continuous, accessible data that advisory instrumentation requires, which periodic or desktop systems cannot.
Pricing transition. Thirty-two percent of growing practices reported having transitioned away from time-based billing toward value-based pricing or fixed monthly retainers (Xero, 2026).
Artificial intelligence adoption. Adoption breadth is near-universal: 88% of practices reported using AI for client deliverables and 86% for firm operations (Intuit, 2026; US frame). Adoption depth, however, diverges sharply: 30%reported AI embedded as a default within daily workflows, while 54% reported situational use. Three in four practices reported that AI had delivered higher return on investment than anticipated (Intuit, 2026; US frame) — an unusual result against the general pattern of enterprise technology under-delivering against expectation.
The breadth–depth divergence is the analytically significant finding, not the headline adoption rate. At 88% adoption, AI use is no longer a differentiating variable; the differentiating variable is structural embedding. Situational use denotes an individual staff member invoking an instrument when it occurs to them: returns are real but capped, unevenly distributed across the team, and contingent on individual habit, and they do not survive personnel turnover. Embedded use denotes AI as a designed component of standard workflow: returns compound, apply uniformly, and persist independently of individuals. The 30% who have achieved embedding are accumulating a structural advantage that the 54% using AI situationally are not.
The data readiness barrier. Asked to identify the principal obstacle to expanding client advisory services, 30% of practices named manual data cleanup — ahead of staffing shortages at 24% and application overload at 16% (Intuit, 2026; US frame).
This finding is the empirical keystone of P3. It is also, on the evidence, routinely misdiagnosed in practice: firms tend to attribute their advisory constraint to talent or to seasonal capacity. The data indicates otherwise. The leading constraint is that the practice’s own data is not of sufficient quality to advise upon without prior manual remediation — which renders an advisory engagement either unprofitable, because remediation consumes the margin, or unreliable, because the counsel rests on unverified figures. This is the data-quality-for-downstream-use problem (Wang & Strong, 1996) presenting as a strategic ceiling.
This is the data quality and downstream-use problem (Wang & Strong, 1996) presenting as a strategic ceiling, and it is the study’s most direct empirical support for P3. The finding that practices nominate data cleanup ahead of both staffing and application overload indicates that the constraint on advisory capability is located in Zone 3 rather than in Zone 4 — that is, upstream of the layer at which practitioners experience it and at which they are inclined to invest. Absorptive capacity (Cohen & Levinthal, 1990) supplies the complementary reading of the AI depth divergence: the capacity to exploit an external knowledge instrument is bounded by the quality of the internal knowledge base it is applied to, which is why embedding — and not adoption — is the variable that distinguishes returns.
4.10 Firm-Tier Stratification
Table 4. Modelled firm-tier structure: expenditure, application density, and scope loss
| Metric | Tier 1 — Solo Practitioner (1 FTE) | Tier 2 — Small Practice (2–10 FTEs) | Tier 3 — Mid-Sized Firm (11–50 FTEs) |
|---|---|---|---|
| Annual software budget | USD 2,500–6,000 | USD 15,000–35,000 | USD 50,000–150,000+ |
| Application density | 4–6 instruments | 8–12 instruments | 12–18+ instruments |
| Zone 1 configuration pattern | Consolidated site-plus-scheduling platforms | Custom or open web platform with CRM and scheduling | Agency-built web, enterprise CRM, custom client portal |
| Zone 2 configuration pattern | Native ledger billing or entry-level engagement platform | Dedicated engagement and payment platforms | Enterprise engagement platform with custom integration |
| Zone 3 configuration pattern | Single all-in-one practice-management platform | Practice-management platform with integrated capture and payroll | Enterprise practice management and enterprise tax platforms |
| Modelled unbilled scope loss | USD 5,000–15,000 / yr | USD 35,000–76,636 / yr | USD 100,000+ / yr |
Source: VerityLoft Research (2026a); scope-loss upper bound at Tier 2 anchored to Ignition (2026). Configuration patterns are descriptive observations of typical instrumentation at each tier, not prescriptions; see Section 2.10.
Three structural patterns are visible. Budget scales superlinearly with headcount, for the integration-cost reason set out in Section 4.1. Density does not proxy sophistication, per P2. And modelled scope loss scales with both size and stakes — not because larger practices are less disciplined, but because scope expands across more clients, more staff, and more service lines, multiplying the occasions at which unbilled work can accumulate undetected. A solo practitioner can hold scope in working memory; a fifteen-person practice cannot, and every uncaptured expansion becomes an institutional rather than an individual loss.
The superlinearity of both budget and scope loss with headcount is consistent with the information-processing account (Galbraith, 1974): coordination requirements grow faster than the units being coordinated, and in a practice without a dedicated operations function that growth is absorbed by fee-earning staff. This is the structural feature distinguishing the professional-services micro-enterprise from the large organisation in which the complementary-assets literature was developed (Brynjolfsson & Hitt, 1998).
4.11 The Regional Compliance Overlay
The taxonomy is universal in structure and regional in execution. Zone 3 in particular is constrained by statute in ways no other zone is.
Table 5. Regional regulatory and market-structure specifications
| Jurisdiction | Primary regulatory authority | Modelled ledger market share | Mandatory compliance drivers | Observed dominant configuration pattern |
|---|---|---|---|---|
| United States | IRS; state departments of revenue | QBO ~75%; Xero ~15% | Form 1099-NEC; economic-nexus sales tax (Wayfair); Form 941 | Cloud ledger + all-in-one practice management + US payroll + AP automation + document capture |
| Canada | CRA; Revenu Québec | QBO ~65%; Xero ~25% | GST/HST; PST/QST input tax credits; T4/T4A; Record of Employment | Cloud ledger + bookkeeping workflow platform + Canadian payroll + Canadian tax preparation |
| United Kingdom | HMRC | Xero ~45%; Sage ~30%; QBO present | Making Tax Digital API filing (VAT, progressively ITSA) | Cloud ledger + formula-driven engagement platform + collaborative practice management + UK payroll |
| Australia | ATO | Xero ~55%; MYOB ~30%; QBO present | Business Activity Statement (10% GST); Single Touch Payroll Phase 2 | Cloud ledger + engagement platform + practice management and document suite + document capture |
| New Zealand | IRD | Xero ~65%+; MYOB present | 15% GST; two-day payday filing | Cloud ledger + practice management + document suite + document capture + payday filing |
Source: VerityLoft Research (2026b); national revenue authorities. Market-share figures are modelled estimates.
Three structural observations follow.
Ledger dominance is regionally bifurcated. The North American markets are anchored on QuickBooks Online; the Commonwealth markets on Xero, with Sage and MYOB as substantial regional challengers. This bifurcation cascades through the entire architecture, because the ledger determines which practice-management and payroll instruments integrate natively and which application marketplace a practice can draw upon. It follows that “full integration” is not a uniform standard across jurisdictions but a market-relative one, and that a practice adopting the non-dominant ledger for its market accepts a thinner native ecosystem and a correspondingly larger manual bridging burden in precisely the zone where integration matters most.
Compliance mandates set the automation floor. In the United States, the economic-nexus standard established in South Dakota v. Wayfair (2018), combined with contractor and employer payroll reporting obligations, makes multi-state sales-tax tracking and ledger-integrated tax automation a practical necessity for any practice serving multi-state clients. In the United Kingdom, HMRC’s Making Tax Digital programme mandates filing through compatible software interfaces rather than manual submission, which has effectively legislated cloud adoption: manual and spreadsheet-based filing is being engineered out of the compliance pathway by the regulator itself. Australia’s Single Touch Payroll Phase 2 converts payroll from a periodic filing into a continuous per-payment reporting obligation. New Zealand’s two-day payday-filing requirement imposes the most time-compressed payroll cadence of the five markets. Canada layers provincial obligations atop federal ones — GST/HST alongside provincial PST and Québec’s separate QST regime, with input tax credit reconciliation — making it arguably the most jurisdictionally intricate Back Office of the five.
Regulatory trajectory converges with the efficiency argument. Read together, the five regimes reveal a common direction of travel: regulators are progressively mandating the real-time, interface-driven, cloud-integrated Back Office that integration coherence already recommends on efficiency grounds. MTD, STP Phase 2, and two-day payday filing each convert a periodic manual filing into a continuous automated one, and each therefore forecloses the fragmented manual configuration as a viable option. Compliance obligation and architectural coherence have converged on the same requirement.
The regulatory finding bears on the framework in a way the efficiency findings cannot: where Making Tax Digital, Single Touch Payroll Phase 2, and two-day payday filing convert periodic manual filings into continuous interface-driven ones, task–technology fit ceases to be a discretionary optimisation and becomes a condition of lawful operation. Regulatory obligation and architectural coherence converge on the same requirement, which means the integration deficit documented in Section 4.3 is, in three of the five markets, a compliance exposure and not only an efficiency one.
4.12 The Cyber-Compliance Overlay at Zone 0
Zone 0 controls are the subject of explicit regulatory mandate across all five markets.
Table 6. Zone 0 regulatory instruments by jurisdiction
| Jurisdiction | Governing instruments | Principal obligations bearing on architecture |
|---|---|---|
| United States | FTC Safeguards Rule (16 CFR Part 314); IRS Publication 4557; Gramm-Leach-Bliley Act | Written Information Security Plan; designated qualified individual; documented risk assessment; encryption, access control and MFA; monitoring and testing; employee training; vendor oversight; documented incident response; annual leadership reporting |
| Canada | CRA EFILE conditions; PIPEDA; Québec Law 25 | Safeguarding of EFILE credentials; mandatory breach reporting and breach records; privacy officer designation; incident register; privacy impact assessments; data portability |
| United Kingdom | HMRC AML supervision; UK GDPR (ICO); Cyber Essentials (NCSC) | Client due diligence and record retention; appropriate technical and organisational measures; 72-hour breach notification; five technical controls including user access control and patch management |
| Australia | ATO Digital Service Provider Operational Security Framework; ACSC Essential Eight | MFA, encryption, personnel security, data hosting and certification requirements for connected software; eight mitigation strategies assessed against a maturity model, including MFA and regular backups |
| New Zealand | Tax Administration Act; Privacy Act 2020 | Taxpayer information confidentiality; security safeguards reasonable in the circumstances (IPP 5); mandatory notification of privacy breaches causing or likely to cause serious harm |
Two points of analytical significance emerge.
First, in the United States the classification of professional tax preparers as financial institutions under the Gramm-Leach-Bliley Act brings them within the scope of the Safeguards Rule. A Written Information Security Plan is therefore a legal requirement for a United States tax practice rather than discretionary guidance, and it applies without regard to headcount: a Tier 1 solo preparer carries the same obligation as a Tier 3 firm. Regulatory obligation does not scale down with practice size, which means Zone 0 cannot be deferred at the smallest tier even though its budget is most constrained there.
Second, the five regimes converge on a common control set: access control and authentication, encryption, data resilience through backup, documented incident response with defined notification timelines, staff training, and vendor due diligence. The statutory instrument differs by jurisdiction; the underlying architecture does not. The practical implication for multi-jurisdictional practices is that constructing Zone 0 to the strictest applicable standard substantially satisfies the others, because the controls are common even where the legal bases are not.
5. Discussion and Managerial Implications
5.1 The Paradox of Rising Expenditure and Falling Coherence
The central empirical tension in the corpus is straightforward to state and consequential to interpret. Expenditure rose by a double-digit percentage within a single benchmark cycle, while only 41% of practices achieved the integration state that converts expenditure into leverage and 48% remained fragmented. The observable cost of that gap is measured in five hours per employee per week, in 90% of practices reporting workforce strain, and in a scope-leakage benchmark that for a substantial share of firms exceeds the entire technology budget that would address it.
This pattern is a domain-specific instance of the productivity paradox and its subsequent resolution. Brynjolfsson (1993) documented the difficulty of observing returns commensurate with IT investment; Brynjolfsson and Hitt (1998) located much of the explanation in the absence of complementary organisational change. The present findings are consistent with that account and sharpen it for the professional-services micro-enterprise, where the complementary asset that is missing is specifically architectural: not process redesign in the general sense, but the deliberate governance of interfaces between independently procured applications.
The mechanism is best expressed in information-processing terms. Each application acquired without integration does not merely fail to reduce coordination load; it adds to it, because the data it produces must now be reconciled with the data produced by every adjacent system. Coordination that the technology was purchased to eliminate is thereby relocated to human actors — and in a small practice, those actors are the same individuals who perform the billable work. This is the structural feature that distinguishes the professional-services micro-enterprise from the large organisation, where coordination load can be absorbed by a dedicated operations function. In a ten-person practice there is no such function; the productivity tax is levied directly on fee-earning capacity.
P1 is supported by the pattern of the evidence, subject to the correlational limits stated in Section 6. The practices reported as pulling ahead on profitability and acquisition are not distinguished by expenditure magnitude but by cloud posture, integration state, and service model. This does not license a causal claim, but it does license the negative claim that expenditure alone is a poor predictor of realised outcome — and that negative claim is sufficient to redirect managerial attention from procurement volume to architectural coherence.
5.2 Integration Coherence as a Moderating Variable
The analytical proposal that follows from Section 5.1 is that integration coherence functions as a moderator rather than a mediator in the relationship between technology expenditure and practice performance. Expenditure creates capability; integration determines what fraction of that capability is realised. Under low coherence, marginal expenditure may yield zero or negative operational return, because the marginal application increases the interface count faster than it reduces manual work.
This reframing has an immediate diagnostic consequence for practitioners: the correct object of a technology audit is not the application inventory but the transfer inventory — an enumeration of every point at which data leaves one system and enters another, classified by whether the transfer occurs automatically or through human intervention. The count of manual transfers, weighted by frequency, is a more informative measure of architectural health than the count of applications, and it maps directly onto the productivity tax.
It also reframes consolidation. Consolidation — reducing application count by adopting platforms that natively absorb adjacent functions — is the primary remedy where achievable, and Zone 3 practice-management platforms are the principal anti-sprawl instrument available, since every function natively absorbed removes one application, one interface, and one recurring manual transfer. But consolidation has a hard limit. Practices require specialised instruments that will not integrate natively with every other instrument they operate, and the regional variation documented in Section 4.11 means no single vendor ecosystem covers a multi-jurisdictional practice’s full obligations. Some portion of the integration deficit is structural rather than remediable by consolidation, and that residual is the proper domain of Zone 0 middleware.
Two cautions attach to the middleware remedy and belong in any complete account. Automation that transports client data requires the same access governance as any other system holding that data, since a stored integration credential is itself a security asset. And undocumented automation constitutes institutional risk: a silently failing automated process is worse than a manual one, because no human is monitoring for its absence. This is the direct link between Zone 0’s integration function and its institutional-knowledge function — automations must be documented as processes rather than retained as tacit knowledge.
5.3 The Economics of the Mid-Office and the Pricing Transition
The leakage economics. The Tier 2 comparison is the clearest economic result in the study. Modelled annual scope leakage at that tier reaches the USD 76,636 benchmark against a total annual software budget of USD 15,000–35,000 across all four value zones. The recoverable loss exceeds the total instrumentation cost of the architecture that would address it — frequently by a multiple.
This inverts the ordinary framing of the technology investment decision. The question is not whether a practice can justify the cost of engagement and billing instrumentation; it is whether it can continue to absorb a substantially larger recurring loss that the instrumentation exists to prevent. Recovering previously unbilled work is, moreover, economically distinctive: it increases revenue without additional client acquisition, additional hiring, or additional hours. In a profession where 90% of practices report workforce strain and capacity is the binding constraint, revenue that requires no additional capacity is categorically more valuable than revenue that does.
The pricing transition. The migration from time-based billing to value-based pricing and fixed retainers — reported at 32% among growing practices — is best understood not as a pricing preference but as the resolution of a structural incompatibility, and this is the substance of P4.
Under time-based billing, automation is partially self-cancelling. Every hour that automation removes from a process is an hour that cannot be billed. A practice that automates Zone 3 production and Zone 2 engagement while continuing to bill by the hour is systematically converting efficiency gains into revenue reductions — engineering, in effect, its own revenue decline as a direct function of its operational improvement. Value-based pricing severs this link: where the practice is compensated for the outcome rather than the elapsed time, every reclaimed hour flows to margin rather than eroding the invoice.
The complementarity runs in both directions, which is why the framework treats the two as a single strategy rather than two independent decisions. Value-based and retainer models require precise scope definition, consistent pricing, and reliable recovery of fees when scope expands — exactly the capabilities Zone 2 instrumentation provides. A fixed fee committed against undefined scope is an exposure to unlimited unbilled work. The engagement stack therefore makes value-based pricing operationally safe, and value-based pricing makes the engagement stack’s efficiency gains economically productive. Neither is fully effective without the other.
The behavioural implication for managers. Because the terminal stage of leakage is interpersonal rather than technical (Section 4.7), interventions that add billing functionality without altering the interaction structure should be expected to underperform. The managerially relevant design criterion is whether the intervention removes the moment of interpersonal confrontation — converting a fee adjustment into a system-mediated routine rather than a conversation an individual must initiate. This is an unusual specification for a technology requirement, and it is not one that feature-comparison procurement processes typically surface.
5.4 The Data Readiness Barrier
The finding that 30% of practices identify manual data cleanup as the principal barrier to advisory expansion — ahead of staffing at 24% and application overload at 16% — is the most strategically consequential result in the corpus, and it supports P3 directly.
Its significance lies in what it displaces. The conventional diagnosis of a practice’s advisory constraint is talent (“we need to hire someone capable of CFO-level work”) or seasonal capacity (“we are consumed by compliance season”). Both appear in the data, and neither leads. The leading constraint is that the practice’s own data cannot be advised upon without prior remediation. An advisory engagement resting on a ledger requiring hours of cleanup is either unprofitable, because remediation consumes the margin, or unreliable, because the counsel rests on unverified figures. There is no third option in which the practice advises confidently on data it does not trust.
This yields the framework’s sharpest practical claim: advisory capability cannot be procured. Deploying financial-intelligence instrumentation atop a fragmented, manually reconciled Back Office produces output that is visually persuasive and analytically unsafe — a liability presented attractively rather than an advisory asset. The sequence must run integration first, intelligence second. The practices extracting genuine advisory value are disproportionately those that resolved Zone 3 before scaling Zone 4.
The same logic governs artificial intelligence, and explains the framework’s dual classification of AI as both zone-resident and horizontal. AI inherits the integration state of the architecture beneath it. Applied to clean, connected data it compounds advantage; applied to fragmented, manually reconciled data it produces confident output that cannot be safely relied upon, amplifying rather than resolving the reconciliation burden. This is the most plausible reading of the observed ROI pattern: the practices reporting the strongest AI returns are disproportionately those that had already closed their integration deficit and thereby supplied the technology with data worth reasoning over. AI rewards a coherent architecture and penalises a fragmented one.
The breadth–depth divergence carries a distinct managerial implication. With adoption at 88%, the strategic question has shifted from whether a practice uses AI to how structurally it does. Embedded deployment — AI as a designed default within standard workflow rather than an instrument invoked by individual initiative — is the configuration whose returns compound, distribute uniformly across the team, and survive personnel turnover. It is also the most direct available response to the capacity findings, functioning as capacity that requires neither hiring nor an onboarding ramp, and addressing both components of reported strain: absorbing routine billable volume and reducing the fragmented-data reconciliation burden.
5.5 Substrate Primacy and the Non-Proportional Failure Distribution
P5 concerns a class of risk that the expenditure and efficiency framing systematically under-weights. Failures within Zones 1 through 4 are proportional and recoverable: a suboptimal instrument costs efficiency, margin, or growth, and the practice migrates. Zone 0 failures are not drawn from the same distribution. Unrecoverable data loss, credential compromise exposing client tax data, or domain impersonation enabling payment redirection can terminate a practice through direct loss, regulatory penalty, withdrawal of electronic filing authorisation, or reputational collapse in a service whose value proposition is fiduciary trustworthiness.
The empirical findings compound this exposure in a specific and underappreciated way. Fragmentation across ten or more applications multiplies both the credential surface requiring protection and the number of independent systems holding recoverable client data. The five weekly hours of manual data movement describe precisely the seams at which handling errors originate. Ninety-percent reported fatigue describes the human conditions under which destructive actions occur. A six-month onboarding ramp describes institutional knowledge residing in individual memory rather than in systems. Each of these is, on the framework’s reading, a Zone 0 exposure before it is anything else.
Two managerial specifications follow. Offboarding is the diagnostic test of credential architecture: where a departing individual’s access cannot be comprehensively revoked within an hour, the architecture is inadequate irrespective of what instruments are deployed. And backup validity is a matter of demonstration rather than assumption — an untested restore is a hypothesis, not a control, and the distinction is material precisely because it is discovered only under the conditions where it matters.
5.6 A Dependency-Ordered Remediation Sequence
The framework’s propositions jointly imply that remediation sequence matters more than instrument selection, because each layer’s achievable performance is bounded by the coherence of the layer beneath it. The sequence supported by the evidence is:
- Establish the substrate (Zone 0). Credential governance and access control first, since credential compromise is both the most probable incident class and the one with the widest blast radius; then outbound domain authentication; then data resilience with a tested restore. Regulatory obligation applies at every tier, including Tier 1.
- Resolve the transactional data foundation (Zone 3). Audit the transfer inventory rather than the application inventory. Consolidate toward natively integrated cores where the market’s dominant ecosystem permits; bridge the structural residual with governed, documented middleware.
- Instrument scope governance and migrate the pricing model (Zone 2). These are a single intervention, not two: engagement automation makes fixed-fee scope safe to commit, and value-based pricing makes automation’s efficiency gains accrue to margin rather than erode the invoice.
- Design the intake funnel for both client cohorts (Zone 1). Provide a self-service digital path and a signposted human alternative, and ensure intake data populates the engagement instrument without re-keying.
- Deploy intelligence and embed AI (Zone 4). Only once the preceding layers supply data that is trustworthy without manual remediation. Target embedded rather than situational AI deployment, and design advisory delivery for both the proficient and tech-limited client cohorts.
Practitioners will observe that this sequence inverts the order in which practice technology is typically purchased, which characteristically begins with the client-visible and analytically attractive layers. That inversion is the framework’s principal practical claim.
6. Study Limitations and Future Research
6.1 Limitations of Secondary Synthesis
The findings of this study are bounded by the character of its evidence base, and those bounds are substantial enough to warrant explicit enumeration.
Absence of primary data and of respondent-level access. No primary data were collected. All quantitative findings are re-reported point estimates from instruments whose full questionnaires, response distributions, and microdata are not publicly available. This precludes independent verification, re-analysis under alternative specifications, and any assessment of item-wording effects.
Single-reviewer screening and unregistered protocol. Source identification, screening, and full-report assessment were performed by the sole author without a second independent reviewer, and no inter-rater agreement statistic can therefore be reported. The review protocol was not registered in advance. PROSPERO, the registry most commonly cited in this connection, accepts only reviews containing at least one direct health-related outcome and was therefore not an eligible destination (Pieper & Rombey, 2022); the appropriate generic registry for a review of this kind is OSF Registries, and the protocol was not lodged there prospectively. Both departures from best practice raise the possibility of selection and confirmation bias in the constitution of the corpus, and both are stated here rather than in mitigation.
Absence of dispersion and precision statistics. None of the constituent datasets publishes standard errors, confidence intervals, or distributional detail. Every mean and proportion reported in Section 4 is therefore a point estimate of unknown precision. Formal meta-analytic procedures — effect-size pooling, heterogeneity estimation, sensitivity and publication-bias analysis — could not be performed, and the study is accordingly meta-aggregative rather than meta-analytic.
Sampling frame heterogeneity and jurisdictional non-equivalence. The three datasets do not share a sampling frame. The most heavily drawn-upon instrument sampled 725 United States practitioners exclusively; the remaining two carry multi-market frames of undisclosed composition. Cross-dataset comparisons therefore rest on an assumption of construct equivalence that cannot be verified. The reader is again cautioned that United States estimates are presented as indicative of profession-wide dynamics, not as measured benchmarks for Canada, the United Kingdom, Australia, or New Zealand.
Self-report and response bias. All constituent instruments rely on practitioner self-report and are exposed to social desirability bias (plausibly deflating admissions of fragmentation, avoidance behaviour, and write-off practice), recall bias (particularly for the temporal and error-frequency estimates), and non-response bias of unknown direction. The five-hour productivity estimate and the two-to-three monthly error frequency are self-assessed quantities not corroborated by observational or systems-log measurement.
Cross-sectional design precludes causal inference. Every association reported is cross-sectional. The relationships between cloud posture and profitability, between advisory provision and client acquisition, and between integration state and time loss are correlational. Reverse causation and common-cause explanations are unexcluded: more profitable practices may adopt cloud infrastructure rather than the reverse, and practices with superior operational discipline may simultaneously integrate their systems and price effectively, with neither causing the other.
Survivorship and self-selection in the multi-market frames. Benchmarking programmes administered through a vendor’s connected practice base sample practices that have already adopted that vendor’s platform and elected to participate. This population is unlikely to be representative of the profession as a whole, and the direction of the resulting bias for cloud-posture and pricing findings is toward overstatement.
Proprietary modelled instruments. The firm-tier and regional-compliance instruments are modelled rather than surveyed, and their derivation methodology is not externally published. They are reported throughout as indicative structural ranges and are explicitly identified as modelled at each point of use. No inferential claim in this study rests on them alone.
6.2 Provenance and Conflict-of-Interest Considerations in the Evidence Base
A limitation specific to this literature requires separate treatment. Two of the three constituent datasets are produced by commercial vendors whose products fall within the functional categories being measured. This creates a structural interest in the direction of certain findings: an engagement-platform producer measuring the cost of unrecovered out-of-scope work, and a cloud-ledger producer measuring the profitability of cloud-first practices, each report on a construct their product is positioned to address.
This does not render the findings unusable, and the study does not treat them as such, for three reasons. The estimates concern observable operational quantities rather than product performance. Several converge with independently produced findings from the third dataset. And the cross-jurisdictional consistency of the leakage benchmark across three national markets is difficult to attribute to instrument design alone. The appropriate posture is calibrated rather than dismissive: findings that align with a producer’s commercial interest warrant a wider credibility interval than findings that are orthogonal to it, and readers should apply that discount specifically to the profitability, acquisition, and leakage magnitudes rather than uniformly across the corpus.
6.3 Limitations of the Framework Itself
The 4-Zone Functional Architecture is a classificatory and diagnostic instrument, and has not been subjected to construct-validation testing. Its zone boundaries are analytically motivated but not empirically derived, and alternative decompositions of the same functional space are plausible. The treatment of artificial intelligence as simultaneously zone-resident and horizontal, while defensible on the evidence, is a departure from clean taxonomic separation and may require revision as AI capability is absorbed into platform defaults across all zones. The framework has been applied to the accounting profession in five common-law, English-language, mature-cloud-ecosystem markets, and its transferability to other professional-services sectors or to jurisdictions with materially different regulatory and vendor landscapes is untested.
The firm-tier stratification excludes practices above 50 FTEs, whose technology posture converges on enterprise IT patterns the constituent datasets do not adequately sample.
6.4 Directions for Future Research
The limitations above map directly onto a research agenda.
Primary instrumented measurement of the productivity tax. The five-hour estimate is self-reported. Direct measurement through systems telemetry, time-and-motion observation, or workflow instrumentation would establish whether practitioners over- or under-estimate the coordination burden, and would permit decomposition of the total by transfer type and by zone.
Longitudinal panel design. A multi-year panel tracking the same practices through integration change would permit causal identification currently unavailable, addressing the reverse-causation problem in the cloud-profitability and advisory-acquisition associations directly.
Construct development and validation of an integration coherence index. The moderating variable proposed in Section 5.2 requires a validated measure. A candidate operationalisation — the proportion of inter-application data transfers occurring without human intervention, frequency-weighted — could be developed, validated against observed time loss, and tested as a moderator of the expenditure–performance relationship.
Quasi-experimental evaluation of scope-governance interventions. The behavioural account in Section 4.7 predicts that interventions removing the interpersonal moment will outperform interventions adding billing functionality. This is directly testable through a difference-in-differences or matched-control design measuring realised recovery of out-of-scope work before and after engagement-automation adoption.
Independent, jurisdiction-stratified replication. The most valuable single contribution to this evidence base would be a non-vendor-sponsored survey with disclosed instrument, published dispersion statistics, and sampling stratified by jurisdiction and firm tier — permitting the national comparisons that the current corpus can only gesture toward.
Depth-of-AI-adoption research. The embedded–situational divergence is the most consequential AI finding in the corpus and the least studied. Research establishing what distinguishes practices achieving embedded deployment, and whether the compounding returns predicted here are realised over time, would be of substantial theoretical and practical value.
Zone 0 incidence and outcome research. The non-proportional failure distribution proposed in Section 5.5 rests on structural argument rather than incidence data. Research establishing the frequency and consequence distribution of substrate failures in accounting practices — data loss events, credential compromises, domain impersonation incidents — would permit that proposition to be tested rather than asserted.
Client-side research. The digital-readiness divide is measured entirely through practitioner report. Client-side measurement of intake and advisory-delivery preference would establish whether the 53/47 split practitioners perceive corresponds to actual client behaviour, and whether bifurcated delivery designs measurably improve conversion and retention.
7. Declarations and Compliance Statements
7.1 Competing Interests
The author declares no competing financial or non-financial interests in relation to this work. The study was conducted independently by VerityLoft Research. No software vendor, platform provider, professional body, or other commercial entity funded, commissioned, sponsored, reviewed, or exercised any influence over the design of this study, the selection or interpretation of its sources, the analysis presented, or the decision to publish.
No product named in this manuscript was tested, evaluated, or benchmarked by the author. Named commercial software appears solely as representative instances populating functional categories within the taxonomy, in accordance with the protocol set out in Section 2.10, and constitutes neither endorsement nor comparative assessment. The author holds no equity, advisory, consulting, or affiliate relationship with any software producer, platform provider, or vendor named or referenced in this manuscript, and received no consideration of any kind from any such party.
The author is affiliated with VerityLoft Research, which produced the two proprietary modelled instruments identified in Section 2.6 and reported in Tables 4 and 5. This relationship is disclosed rather than mitigated, and the constraints imposed on the use of those instruments are specified in Section 2.6: they are reported as indicative structural ranges, are labelled as modelled at every point of use, and support no inferential claim, proposition test, or conclusion in this study, whether alone or in combination. A reader who disregards both instruments entirely will find no proposition in Section 3.8 left unsupported.
7.2 Funding
This research received no specific grant from any funding agency in the public, commercial, or not-for-profit sectors. It was conducted using the internal resources of VerityLoft Research.
7.3 Data Availability Statement
This study analysed no primary data. All quantitative findings derive from secondary aggregated benchmark datasets published by third parties, identified in full in Table 1 and in the reference list. Respondent-level microdata for these datasets are held by their respective producers and were not accessible to the author; enquiries regarding underlying data should be directed to the producing organisations.
Regulatory parameters were extracted from publicly available instruments published by the named revenue, privacy, and cyber-security authorities and are accessible through those authorities’ official publication channels.
The proprietary Firm-Tier Benchmarking Model and Regional Compliance Matrix are modelled instruments developed by VerityLoft Research. Their outputs are reproduced in full in Tables 4 and 5 of this manuscript. They are identified as modelled at every point of use and no inferential claim rests upon them independently.
The review protocol, the full search log described in Section 2.3, and the excluded-with-reasons list underlying Figure 1 are deposited with the Open Science Framework (https://osf.io/registries). The extraction and normalisation records supporting the synthesis in Section 4 are available from the author upon reasonable request.
7.4 Ethics Approval and Consent
Ethics approval was not required. This study involved no human participants, no animal subjects, and no collection or processing of personal data. It constitutes a synthesis of previously published aggregate findings and publicly available regulatory instruments.
7.5 Author Contributions
The author was solely responsible for study conception and design, source identification and screening, data extraction and normalisation, framework development, analysis and interpretation, and the drafting and revision of the manuscript. The author read and approved the final manuscript.
7.6 Use of Artificial Intelligence in Manuscript Preparation
The use of artificial intelligence tools in this review is documented in full in Section 2.12 as part of the method. In summary: large language model tools were used in an editorial and formatting capacity only — language editing, structural organisation, terminology consistency, and table and reference formatting. No such tool was used for source identification or selection, quantitative extraction, framework development, or analytical inference, and no large language model is listed as an author. All source selection, data extraction, analytical judgements, theoretical framing, and substantive conclusions are the author’s own, and the author accepts full responsibility for the integrity and accuracy of the content presented.
7.7 Disclaimer
Regulatory frameworks are summarised for general informational purposes and do not constitute legal, tax, or compliance advice. Security, privacy, and tax obligations vary by jurisdiction, entity structure, and client base, and are subject to change. Practices should confirm their specific obligations with appropriately qualified professional advisers.
Nothing in this manuscript should be construed as a recommendation to purchase, adopt, or refrain from adopting any commercial software product.
References
Adams, R. J., Smart, P., & Huff, A. S. (2017). Shades of grey: Guidelines for working with the grey literature in systematic reviews for management and organizational studies. International Journal of Management Reviews, 19(4), 432–454. https://doi.org/10.1111/ijmr.12102
Australian Cyber Security Centre. (2026). Essential Eight maturity model. Australian Signals Directorate. https://www.cyber.gov.au/
Australian Taxation Office. (2026). Business activity statements and Single Touch Payroll Phase 2 employer reporting guidelines. Australian Government. https://www.ato.gov.au/
Australian Taxation Office. (2026). Digital Service Provider operational security framework. Australian Government. https://www.ato.gov.au/
Brynjolfsson, E. (1993). The productivity paradox of information technology. Communications of the ACM, 36(12), 66–77. https://doi.org/10.1145/163298.163309
Brynjolfsson, E., & Hitt, L. M. (1998). Beyond the productivity paradox. Communications of the ACM, 41(8), 49–55. https://doi.org/10.1145/280324.280332
Canada Revenue Agency. (2026). EFILE for electronic filers: Security and confidentiality requirements. Government of Canada. https://www.canada.ca/en/revenue-agency.html
Cohen, W. M., & Levinthal, D. A. (1990). Absorptive capacity: A new perspective on learning and innovation. Administrative Science Quarterly, 35(1), 128–152. https://doi.org/10.2307/2393553
Commission d’accès à l’information du Québec. (2026). Act to modernize legislative provisions as regards the protection of personal information (Law 25): Compliance obligations. Gouvernement du Québec. https://www.cai.gouv.qc.ca/
Davenport, T. H. (1998). Putting the enterprise into the enterprise system. Harvard Business Review, 76(4), 121–131.
Federal Trade Commission. (2026). Standards for safeguarding customer information (Safeguards Rule), 16 C.F.R. Part 314. https://www.ftc.gov/
Galbraith, J. R. (1974). Organization design: An information processing view. Interfaces, 4(3), 28–36. https://doi.org/10.1287/inte.4.3.28
Garousi, V., Felderer, M., & Mäntylä, M. V. (2019). Guidelines for including grey literature and conducting multivocal literature reviews in software engineering. Information and Software Technology, 106, 101–121. https://doi.org/10.1016/j.infsof.2018.09.006
Goodhue, D. L., & Thompson, R. L. (1995). Task-technology fit and individual performance. MIS Quarterly, 19(2), 213–236. https://doi.org/10.2307/249689
Gramm-Leach-Bliley Act, 15 U.S.C. §§ 6801–6809 (1999).
His Majesty’s Revenue and Customs. (2026). Anti-money laundering supervision for accountancy service providers. UK Government. https://www.gov.uk/
His Majesty’s Revenue and Customs. (2026). Making Tax Digital: VAT and income tax self assessment. UK Government. https://www.gov.uk/
Ignition. (2026). State of client engagement global report [Survey conducted with YouGov]. Ignition. https://www.ignitionapp.com/
Information Commissioner’s Office. (2026). Guide to the UK General Data Protection Regulation: Security and personal data breaches. https://ico.org.uk/
Inland Revenue Department. (2026). Payday filing and goods and services tax obligations. New Zealand Government. https://www.ird.govt.nz/
Internal Revenue Service. (2026). Publication 4557: Safeguarding taxpayer data — A guide for your business. U.S. Department of the Treasury. https://www.irs.gov/
Intuit. (2026). Accountant technology survey 2026 [Survey of 725 United States accounting professionals, fielded May 2026]. Intuit Inc. https://www.intuit.com/
Malone, T. W., & Crowston, K. (1994). The interdisciplinary study of coordination. ACM Computing Surveys, 26(1), 87–119. https://doi.org/10.1145/174666.174668
Markus, M. L., & Tanis, C. (2000). The enterprise system experience: From adoption to success. In R. W. Zmud (Ed.), Framing the domains of IT management: Projecting the future through the past (pp. 173–207). Pinnaflex Educational Resources.
Melville, N., Kraemer, K., & Gurbaxani, V. (2004). Review: Information technology and organizational performance — An integrative model of IT business value. MIS Quarterly, 28(2), 283–322. https://doi.org/10.2307/25148636
National Cyber Security Centre. (2026). Cyber Essentials: Requirements for IT infrastructure. UK Government. https://www.ncsc.gov.uk/
Office of the Privacy Commissioner of Canada. (2026). Personal Information Protection and Electronic Documents Act: Breach of security safeguards reporting. Government of Canada. https://www.priv.gc.ca/
Office of the Privacy Commissioner of New Zealand. (2026). Privacy Act 2020: Notifiable privacy breaches and information privacy principles. New Zealand Government. https://www.privacy.org.nz/
Page, M. J., McKenzie, J. E., Bossuyt, P. M., Boutron, I., Hoffmann, T. C., Mulrow, C. D., Shamseer, L., Tetzlaff, J. M., Akl, E. A., Brennan, S. E., Chou, R., Glanville, J., Grimshaw, J. M., Hróbjartsson, A., Lalu, M. M., Li, T., Loder, E. W., Mayo-Wilson, E., McDonald, S., … Moher, D. (2021). The PRISMA 2020 statement: An updated guideline for reporting systematic reviews. BMJ, 372, n71. https://doi.org/10.1136/bmj.n71
Pieper, D., & Rombey, T. (2022). Where to prospectively register a systematic review. Systematic Reviews, 11, 11. https://doi.org/10.1186/s13643-021-01877-1
Privacy Act 2020, No. 31 (N.Z.). https://www.legislation.govt.nz/
Revenu Québec. (2026). QST registration, reporting and input tax refund obligations. Gouvernement du Québec. https://www.revenuquebec.ca/
Singh, R. (2026). The 2026 accounting technology research series: Global benchmarks, app sprawl, and the 4-Zone Functional Architecture. VerityLoft Research, Practice Technology Benchmark Series. https://verityloft.com/research-the-state-of-accounting-technology/
South Dakota v. Wayfair, Inc., 585 U.S. 162 (2018).
Tax Administration Act 1994, No. 166 (N.Z.). https://www.legislation.govt.nz/
VerityLoft Research. (2026a). 2026 firm-tier benchmarking model [Proprietary modelled instrument]. VerityLoft Research. https://verityloft.com/
VerityLoft Research. (2026b). 2026 regional compliance matrix [Proprietary modelled instrument]. VerityLoft Research. https://verityloft.com/
Tyndall, J. (2010). AACODS checklist. Flinders University. https://dspace.flinders.edu.au/
Wang, R. Y., & Strong, D. M. (1996). Beyond accuracy: What data quality means to data consumers. Journal of Management Information Systems, 12(4), 5–33. https://doi.org/10.1080/07421222.1996.11518099
Xero. (2026). State of the industry: Global practice benchmarks. Xero Limited. https://www.xero.com/
Appendix A. Nomenclature and Construct Definitions
| Construct | Definition as operationalised in this study |
|---|---|
| Application sprawl | The accumulation of functionally rational but architecturally uncoordinated software instances within a single practice, and the operational friction that accumulation generates. |
| Productivity tax | Recurrent labour time consumed by manual data transfer between non-integrated systems, measured in hours per employee per week. |
| Scope leakage | The divergence between professional value delivered and revenue realised, arising from work performed outside the defined engagement boundary and never invoiced. |
| Integration coherence | The extent to which inter-application data transfers within a practice occur without human intervention; proposed in Section 5.2 as a moderator of the expenditure–performance relationship. |
| Data readiness barrier | The condition in which a practice’s transactional data cannot support advisory output without prior manual remediation, rendering advisory engagements either unprofitable or unreliable. |
| Shared-responsibility gap | The distinction between infrastructure redundancy, which cloud platforms provide, and user-error resilience, which remains the practice’s own obligation. |
| Embedded versus situational AI deployment | Embedded: artificial intelligence as a designed default within standard workflow. Situational: invocation at individual discretion. The distinction governs whether returns compound and survive personnel turnover. |
| Client digital-readiness divide | The near-parity division of the client base between digitally proficient and digitally limited cohorts, obliging practices to operate parallel service pathways. |
Appendix B. Summary of Principal Quantitative Findings
| Finding | Value | Source | Frame |
|---|---|---|---|
| Mean annual software expenditure | USD 21,000–22,000 (prior cycle ~USD 19,000) | Intuit (2026) | US |
| Mean application count | 10; one in three at 11–25+ | Intuit (2026) | US |
| Fully integrated stack | 41% | Intuit (2026) | US |
| Fragmented stack | 48% | Intuit (2026) | US |
| Productivity tax | 5 hours per employee per week | Intuit (2026) | US |
| Employee fatigue or burnout | 90% (25% attributed to fragmented data; 37% to billable volume) | Intuit (2026) | US |
| Entry-level ramp of six months or more | 56% | Intuit (2026) | US |
| Principal CAS barrier | Manual data cleanup 30%; staffing 24%; app overload 16% | Intuit (2026) | US |
| Client digital readiness | 53% proficient; 47% limited | Intuit (2026) | US |
| AI adoption — client deliverables | 88% | Intuit (2026) | US |
| AI adoption — firm operations | 86% | Intuit (2026) | US |
| AI deployment depth | 30% embedded; 54% situational | Intuit (2026) | US |
| AI return above expectation | Three in four practices | Intuit (2026) | US |
| Unrecovered out-of-scope work | USD 76,636 (US); >AUD 90,000 (AU); GBP 69,957 (UK) | Ignition (2026) | Multi-market |
| Scope-conversation avoidance | 88% delay or avoid; 43% absorb cost | Ignition (2026) | Multi-market |
| Manual proposal or engagement-letter errors | 88% of practices, 2–3 times monthly | Ignition (2026) | Multi-market |
| Late-payment pursuit | 94%; mean 30 days overdue; 38% write off | Ignition (2026) | Multi-market |
| CAS client acquisition | 58 net-new clients/yr vs 33 (75% higher) | Xero (2026) | Multi-market |
| Cloud-first profit surge rate | 75% vs 54% non-cloud | Xero (2026) | Multi-market |
| Transition to value-based pricing | 32% of growing practices | Xero (2026) | Multi-market |
Manuscript prepared for posting as an SSRN working paper (Accounting Research Network; Information Systems & eBusiness Network) and for subsequent submission to peer-reviewed open-access journals in accounting information systems.